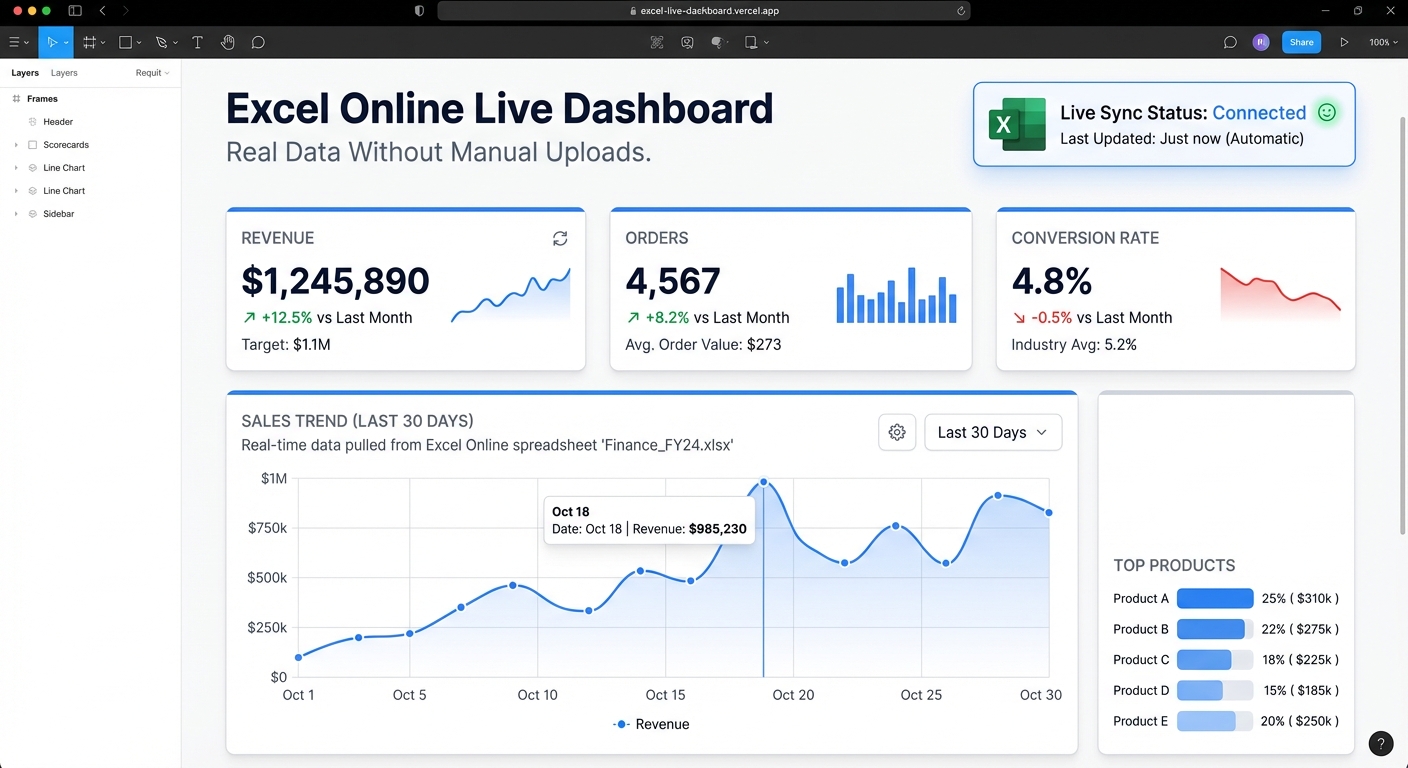
Excel Online live dashboards are now possible in Infograph. Connect your Microsoft account, select an Excel file from OneDrive or SharePoint, and your dashboard stays live — updating automatically when the spreadsheet changes.
No file uploads. No re-running reports. No “which version is current?” conversations.
What This Means
The old workflow for Excel-based dashboards looked like this:
- Update the spreadsheet
- Export or copy the data
- Rebuild or refresh the dashboard manually
- Share the updated version with everyone who needs it
That’s four manual steps every time your data changes. For teams that update weekly, that’s a part-time job.
With an Excel Online live connection, the workflow is:
- Update the spreadsheet
That’s it. The dashboard picks up the changes automatically.
How to Connect Excel Online
- Go to app.infograph.ai and start a new dashboard
- Choose Connect a data source → Microsoft Excel Online
- Authenticate with your Microsoft account
- Browse to your Excel file in OneDrive or SharePoint and select the sheet you want to connect
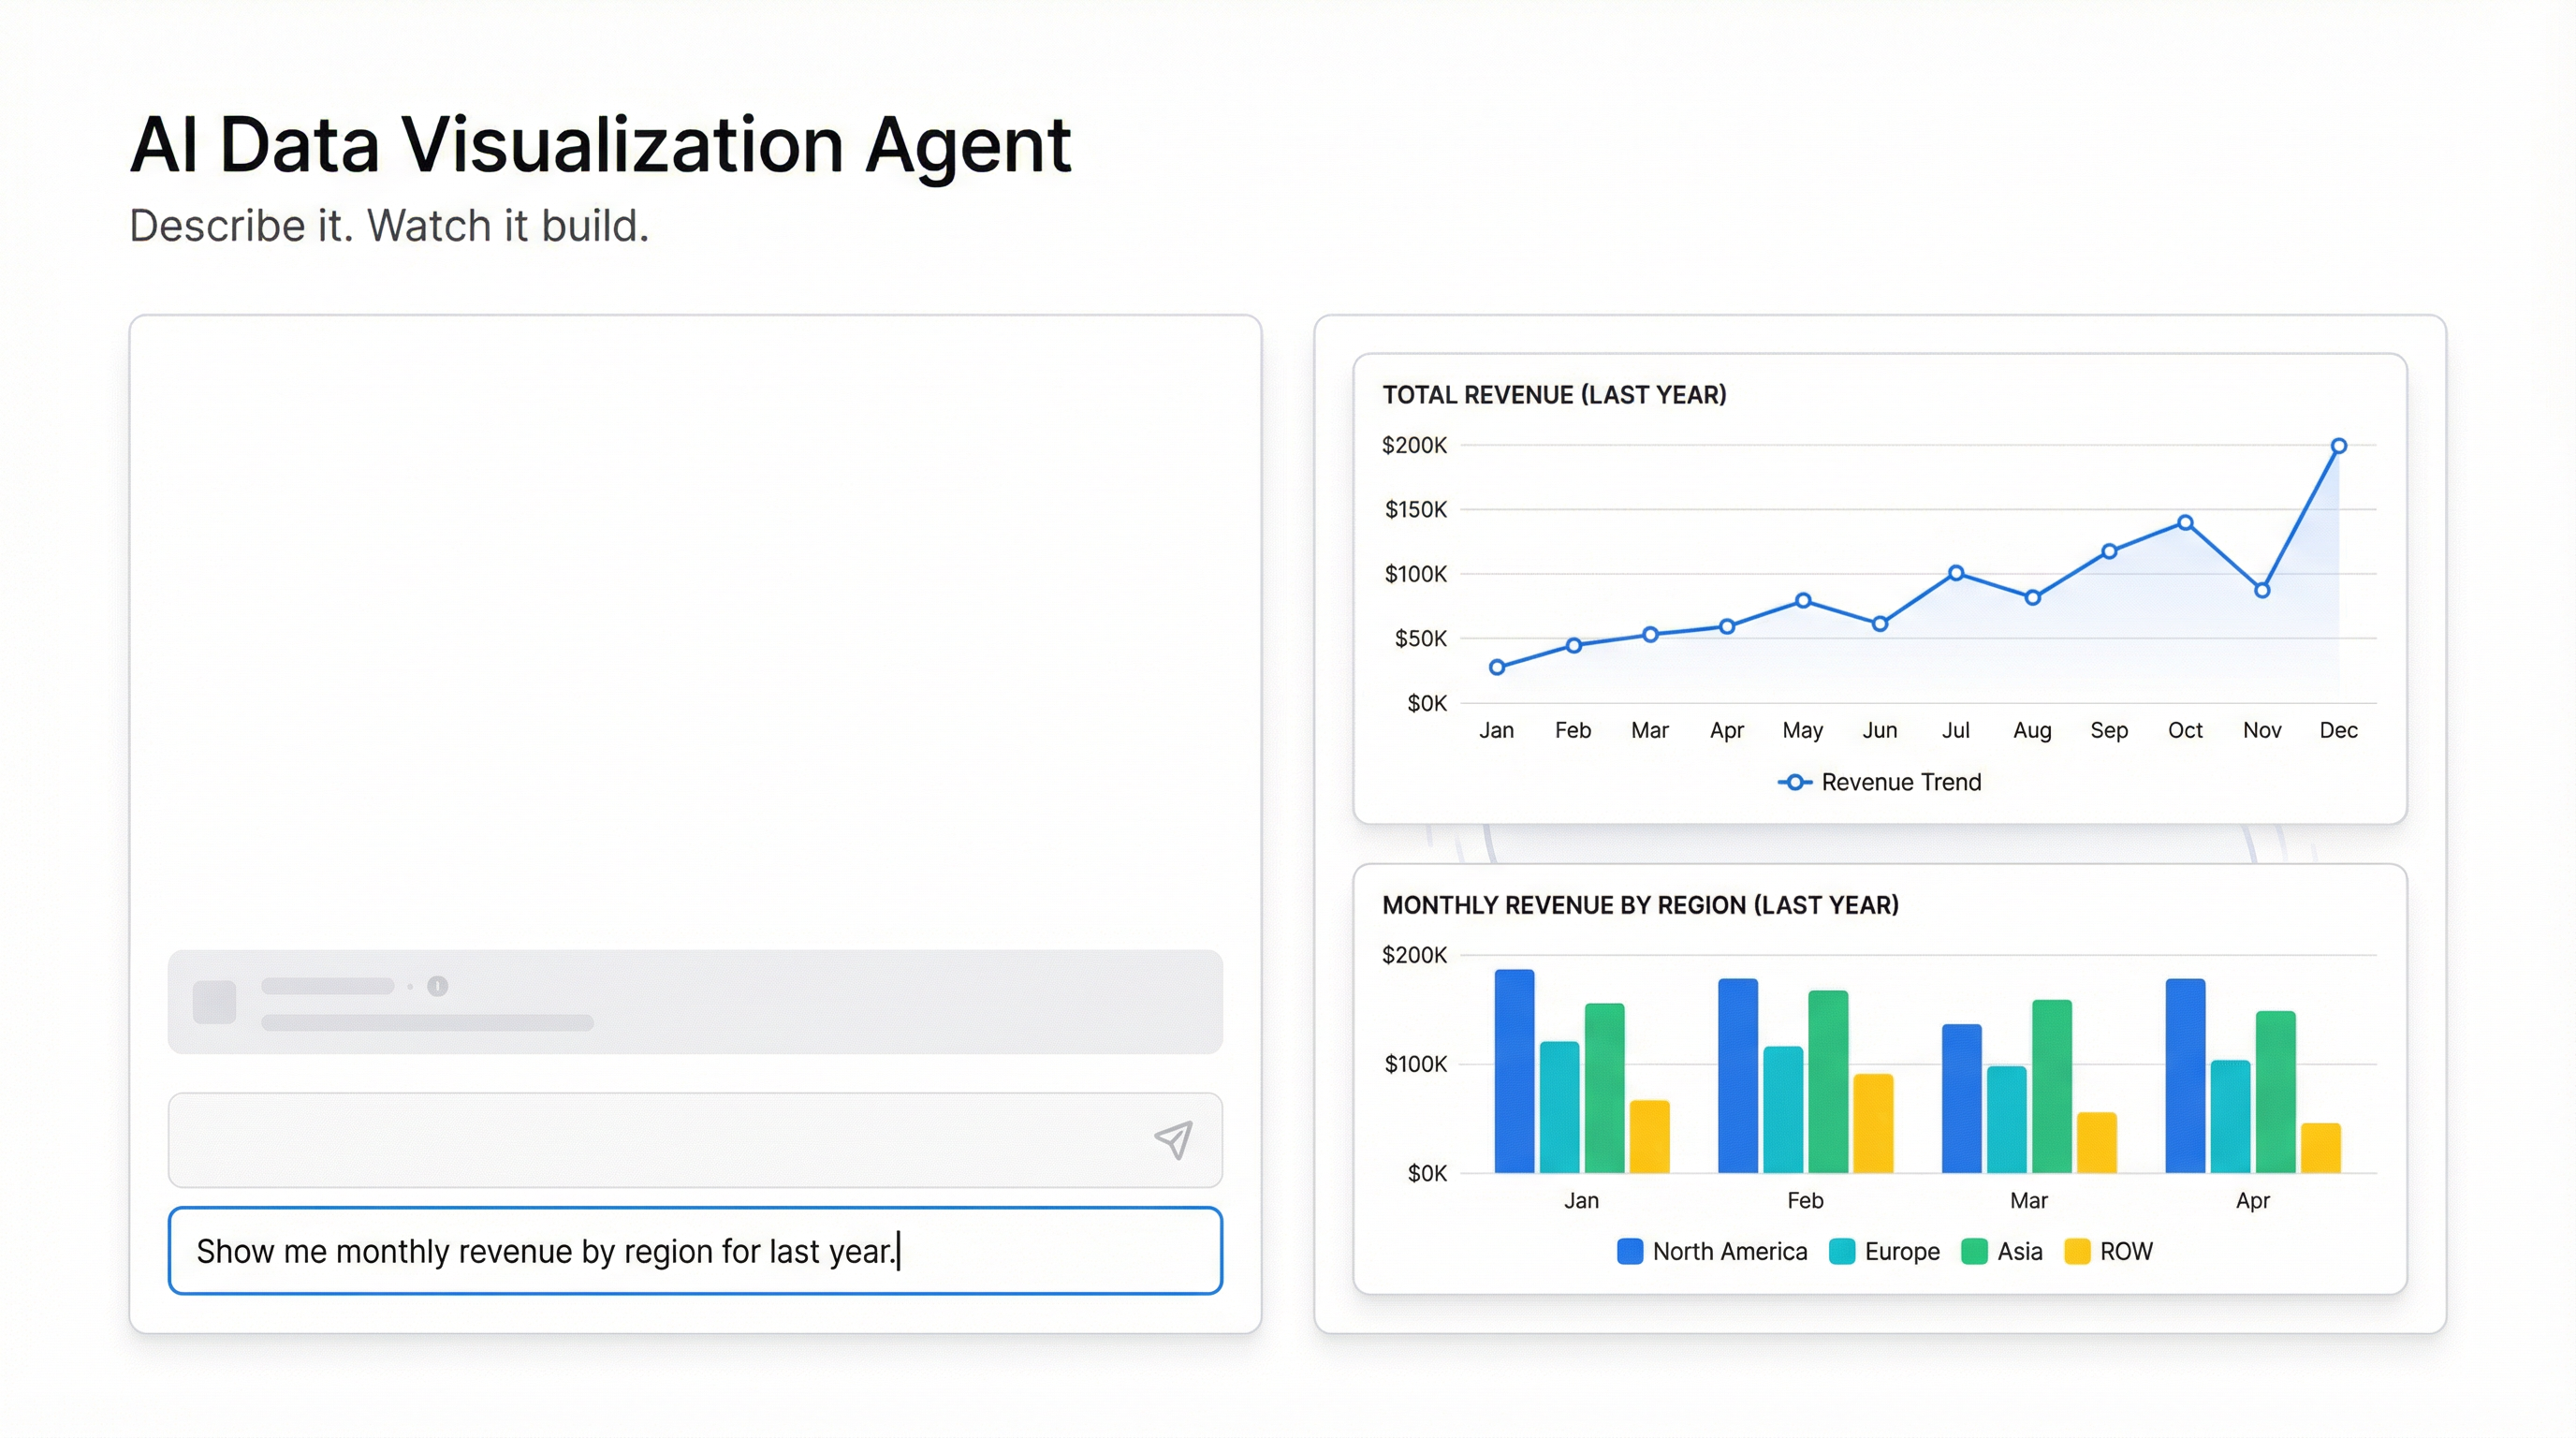
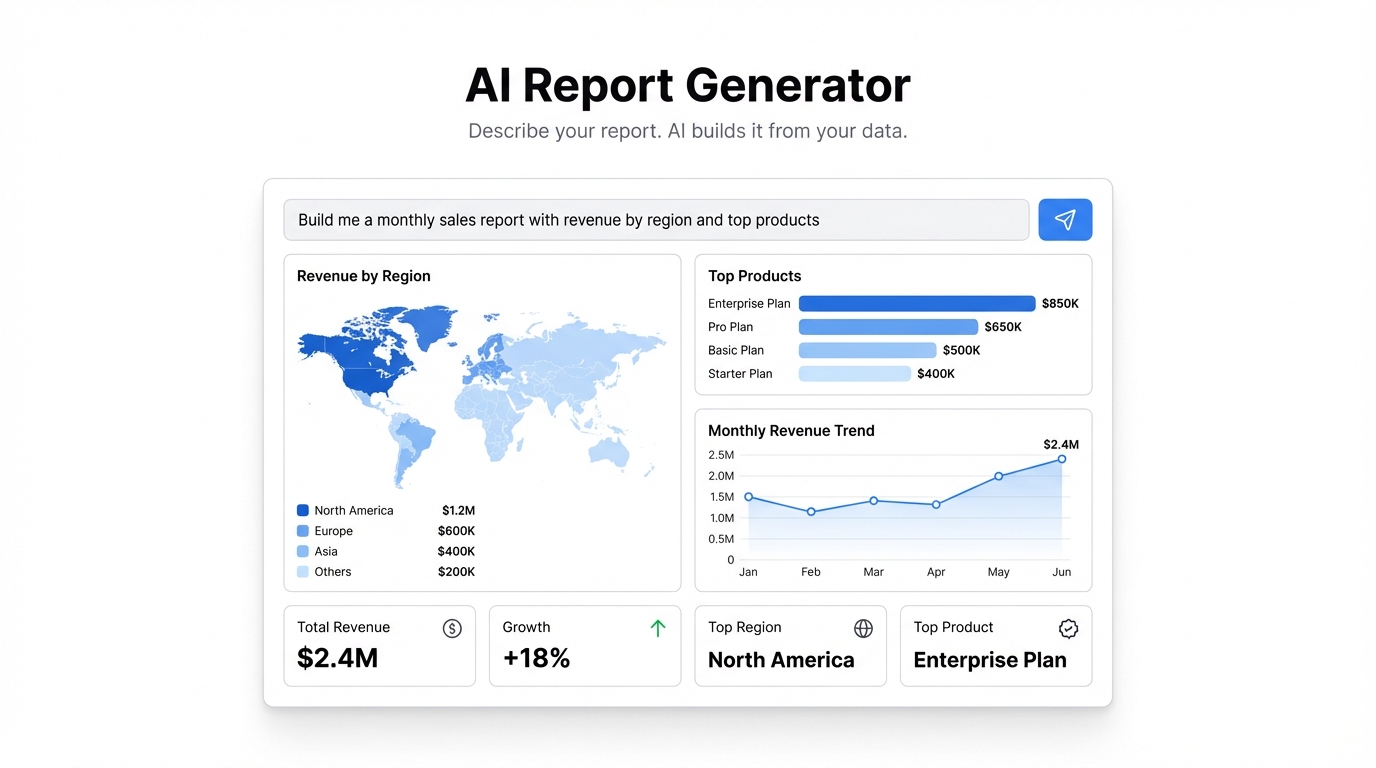
- Prompt Infograph to build the dashboard: “Show monthly sales by region, top 10 customers by revenue, and conversion funnel”
The connection is live from that point. Edit the Excel file, and the dashboard reflects the change.
What It Works With
The Excel Online connection works with any .xlsx file hosted in OneDrive or SharePoint. It reads the sheet structure, respects named ranges and tables, and handles multi-tab workbooks.
For workbooks with multiple sheets, you can either connect a single sheet or pull from several sheets into one dashboard. If your data is spread across Revenue, Pipeline, and Headcount tabs, you can reference all three in a single dashboard prompt.
Why Live Data Changes Everything
Dashboards that require manual updates don’t stay current. They get updated once a month for a board meeting and ignored the rest of the time. When the data is stale, people stop trusting it. When people stop trusting it, they stop using it. When they stop using it, it was never a dashboard — it was a slideshow.
A live connection removes the friction. The dashboard is always current because it’s reading directly from the source. You don’t have to remember to update it — it updates itself.
For teams already living in Excel Online, connecting to Infograph takes five minutes and pays off immediately. The spreadsheet is your source of truth; the dashboard is the view on top of it.
Teams and Sharing
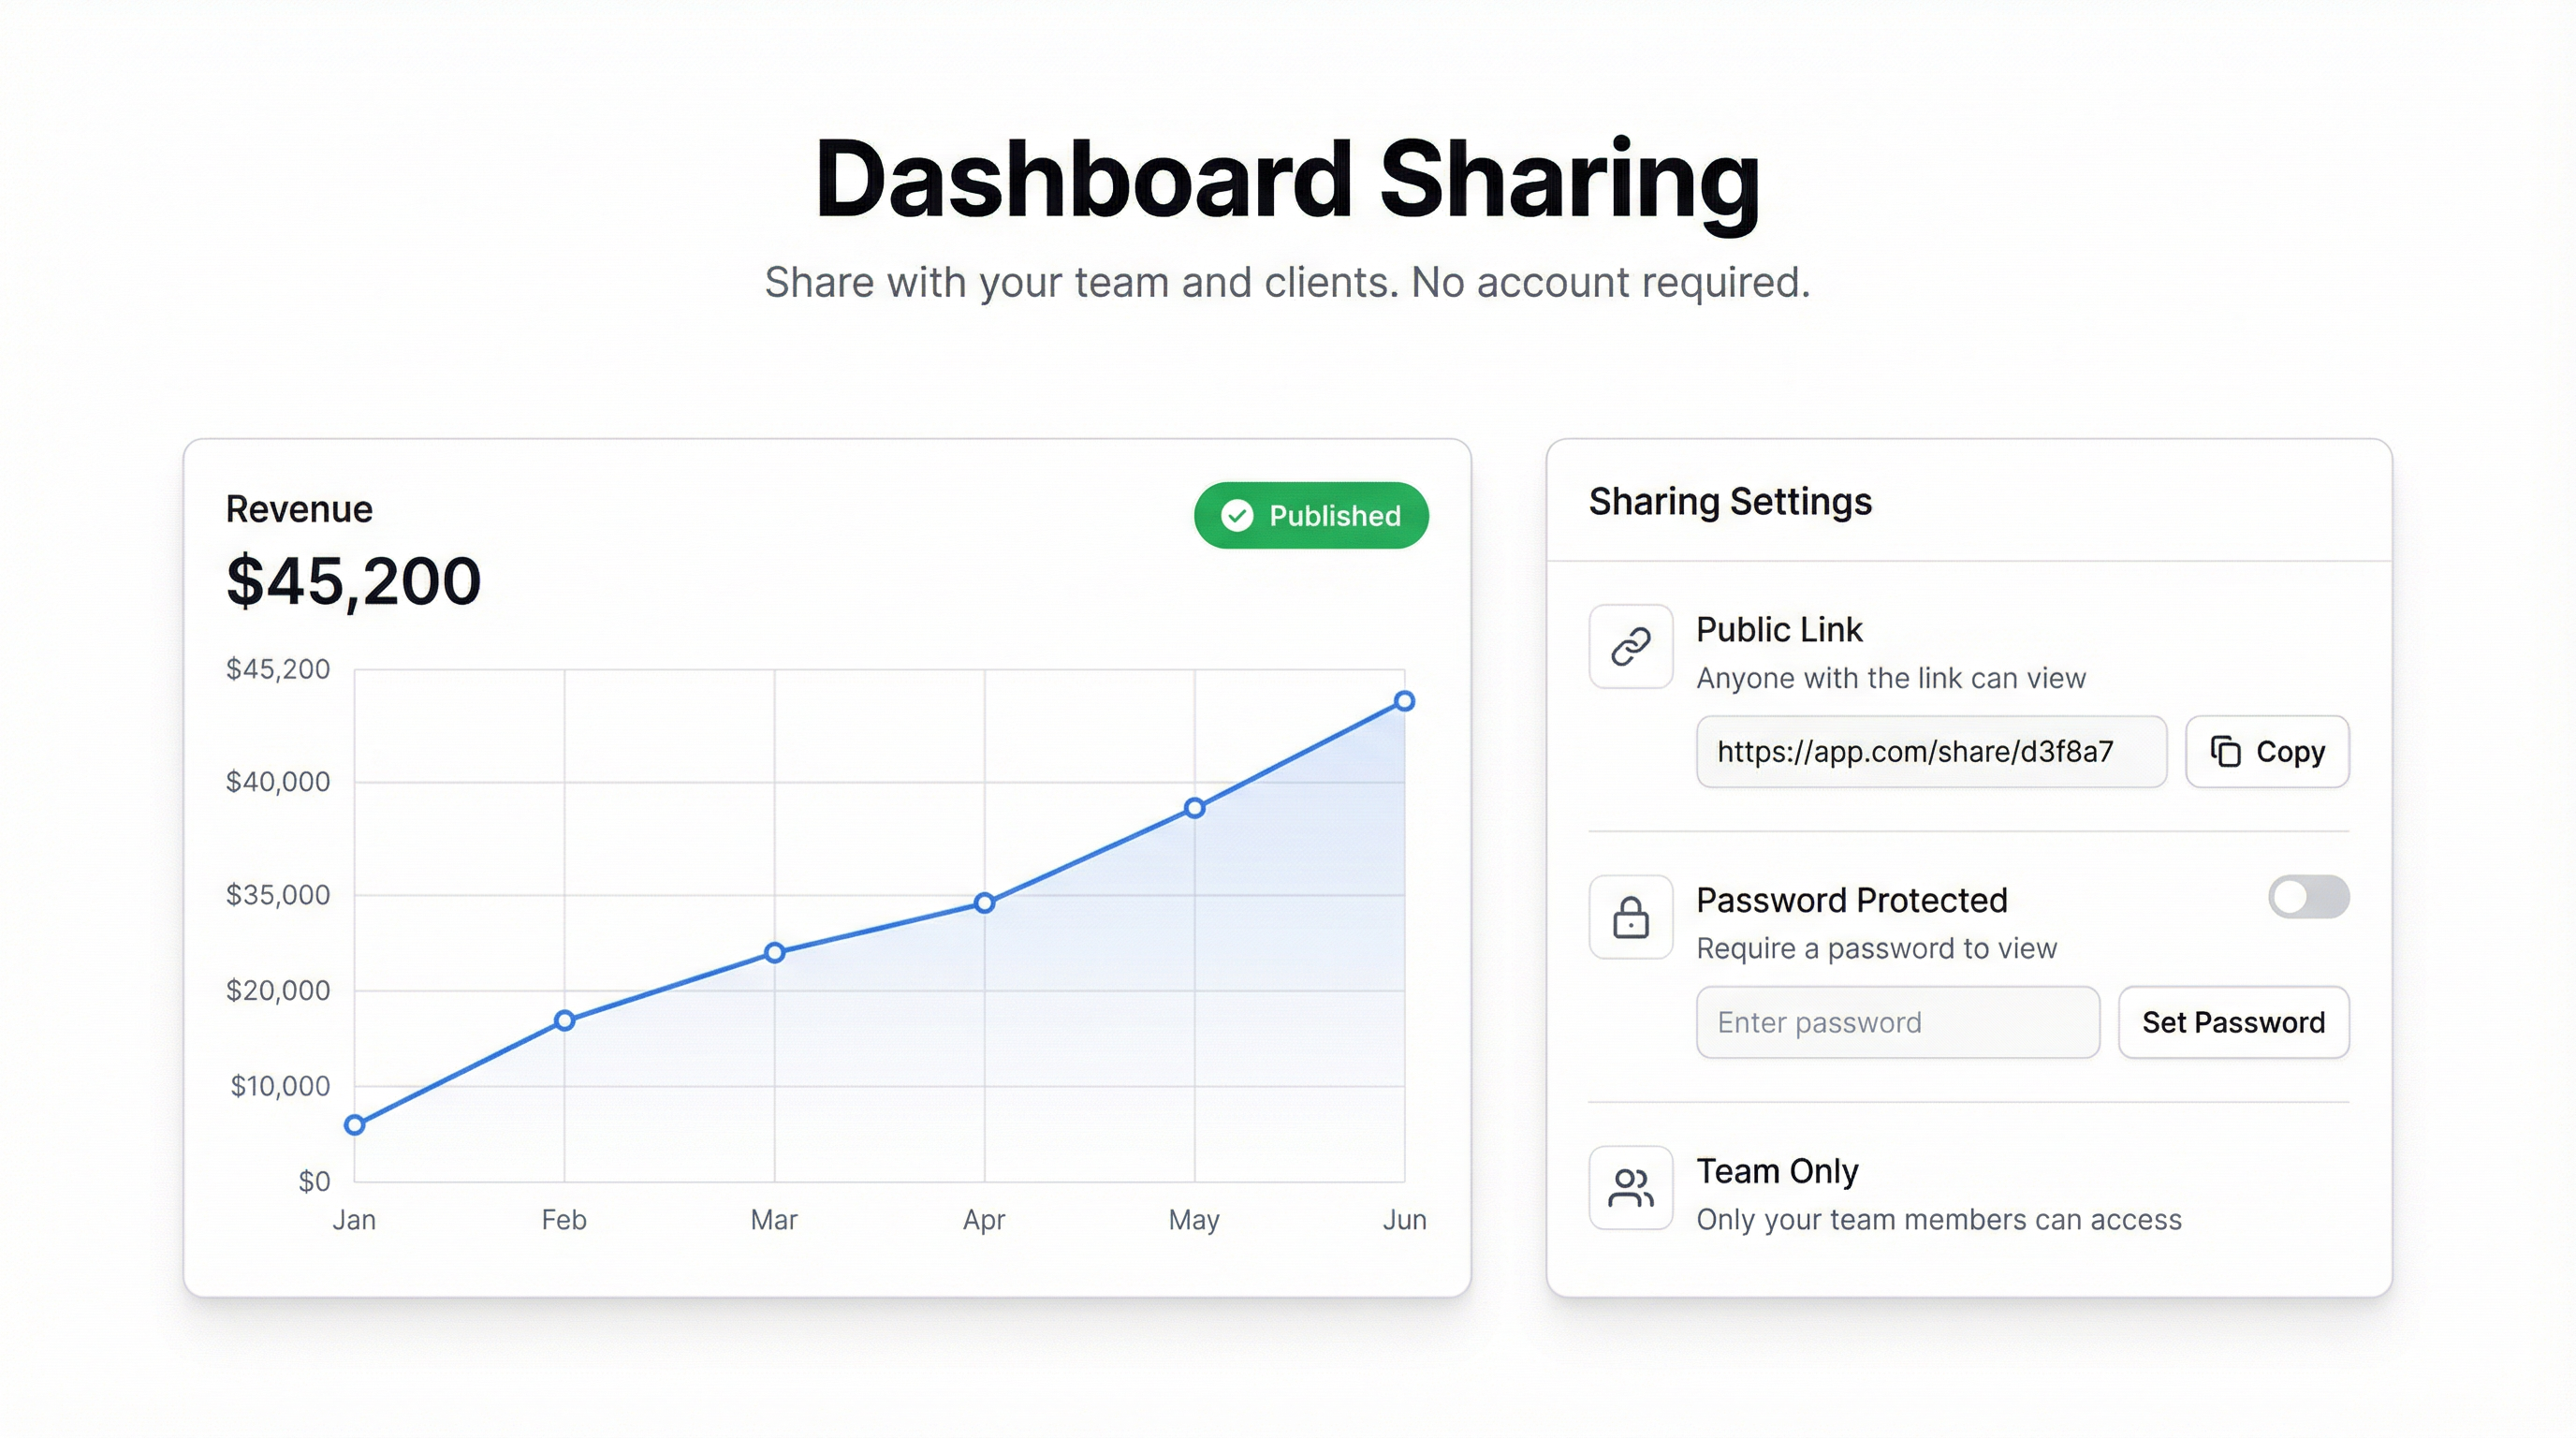
Once your live dashboard is built, share it with a link. Set access to team-only, password-protected, or public depending on your audience. Shared dashboards reflect data changes in real time — everyone who has the link sees the current state.
For Teams plan users, multiple colleagues can connect their own data sources and build dashboards that share the same data. One Excel file, multiple dashboards, multiple audiences.
Try It Now
Connect your Excel Online file and build your first live dashboard in minutes.