Most support teams drown in tickets while flying blind on performance. The queue number goes up, the team scrambles, but nobody has a clear view of where time is going, which issues are recurring, or whether response times are actually getting worse.
A customer support dashboard fixes that. Not by adding more metrics — by surfacing the right ones, live, so you can act before a bad week turns into a churn spike.
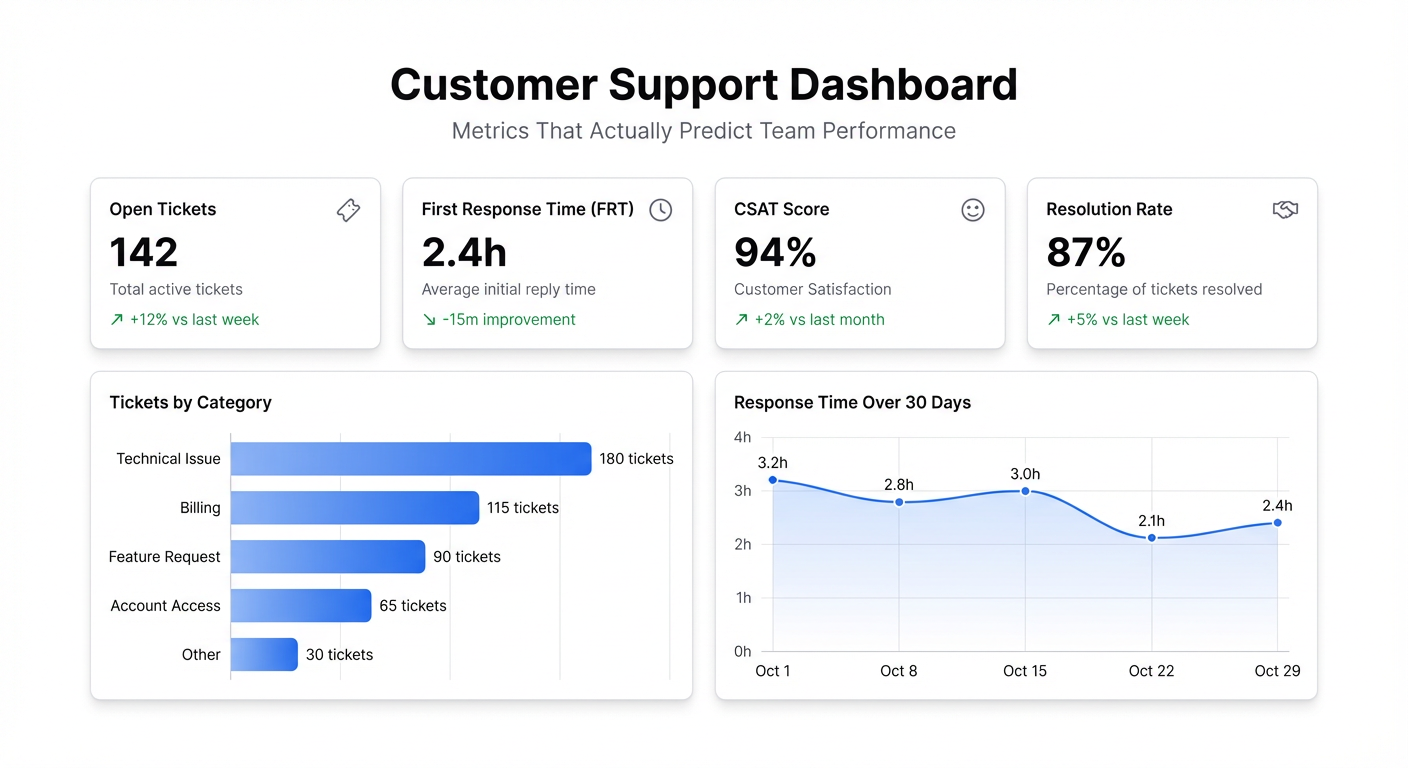
What belongs on a support dashboard
First response time is the number customers actually feel. Not resolution time — first response. The moment someone hears back from a human (or an AI that routes them correctly) is when their anxiety starts dropping. Track this by hour of day and day of week. Most support teams have blindspots: the 9–10am window when tickets pile up before the team is fully staffed, or Friday afternoons. The pattern shows you where to focus.
Ticket volume by category is the metric that reveals product problems hiding behind support tickets. When 30% of your tickets this week are “how do I export my data,” that’s not a support problem — it’s a UX problem. A good support dashboard surfaces these clusters so the product team can address the source instead of patching the symptom.
CSAT score needs to be tracked over time, not as a single number. An average of 4.2 out of 5 tells you nothing. CSAT trending from 4.2 to 3.8 over six weeks while ticket volume is flat tells you something is wrong with how tickets are being handled, not how many there are.
Resolution time by ticket type matters because not all tickets take the same effort. A billing question that takes 45 minutes to resolve is a process failure. A complex technical issue that takes 45 minutes is expected. Segment by category and you’ll quickly see which ticket types are eating disproportionate time — those are your automation candidates.
Backlog age — specifically, how many tickets have been open for more than 24, 48, or 72 hours. A queue of 200 tickets with an average age of 4 hours is manageable. A queue of 50 tickets where 20 have been sitting for 3 days is a problem. The raw count lies. Age-weighted backlog tells the truth.
Agent workload distribution shows whether your team capacity is being used evenly. One agent handling 40% of all tickets while two others at 15% isn’t an efficiency problem — it’s a management problem. Surface it and you can fix it.
The metrics most dashboards miss
Deflection rate — the percentage of tickets that get resolved by self-service before reaching an agent — is the one metric that directly shows whether your help docs are working. If you have a knowledge base, measure how often customers find answers there versus submitting a ticket. Low deflection means your docs need work, or your search is broken.
Re-open rate tells you about resolution quality, not resolution speed. Closing a ticket fast is worthless if the customer comes back with the same issue two days later. Track re-opens as a percentage of resolved tickets, by agent and by ticket category. High re-opens in one category usually means the resolution script is wrong.
SLA breach rate matters most for teams with formal support commitments. If you’re promising 4-hour first response to enterprise customers, track breach rate weekly. When it starts creeping up, you know before the customer complains.
Why a live dashboard matters here
Support is a real-time operation. A weekly CSV export of ticket data is useful for post-mortems. It’s useless when you need to know, right now, that first response time has jumped to 6 hours because two agents called in sick and nobody reassigned their queue.
When your support dashboard is connected to your helpdesk (Zendesk, Intercom, Freshdesk all export to CSV or Google Sheets), the view updates as tickets flow through. You can see a surge forming before it becomes a crisis.
Building a support dashboard in Infograph
Export your ticket data from your helpdesk — most support tools let you pull CSV exports or connect via Google Sheets integration. For live data, connect the Google Sheet directly so the dashboard updates as your helpdesk writes to it.
Upload to Infograph, then describe what you want to see: “Show me ticket volume by day, first response time by agent, CSAT trend over the last 30 days, and open ticket count by category.” The AI builds the view. Adjust the filters and groupings until it matches how you review your team’s performance.
Share it with your support leads. Put it on a monitor in the support room if you have one. The goal is to make the signal visible so the team can respond to it — not to create another report that gets sent in a Monday morning email.
The support teams I’ve seen handle high volume best aren’t necessarily the ones with the largest teams. They’re the ones who know what’s happening in their queue at any given moment. The dashboard is how you get there.


