Most product managers are making decisions based on data that’s a week old, formatted by someone else, and missing the one cut they actually need.
The retention cohort from last Tuesday. Feature adoption broken down by plan tier. DAU/MAU ratio filtered to just the users who actually got through onboarding. That stuff exists in your database — it’s just not in front of you when you need it.
A product analytics dashboard fixes that. Not a Mixpanel subscription, not a BI tool that needs a data engineer to set up, not a spreadsheet you export every Monday. An actual live dashboard that answers your questions as fast as you can type them.
What Goes in a Product Analytics Dashboard
There’s no universal list. The metrics that matter depend entirely on what your product does and where you are in the growth curve. That said, most product teams end up tracking some version of the same five things:
Engagement — DAU, WAU, MAU, and the ratios between them. DAU/MAU tells you something different than raw DAU. A product with 10k DAU and 50k MAU has a retention problem. A product with 10k DAU and 12k MAU has something working.
Retention — Week 1 retention is the only metric that predicts everything else. If users don’t come back in the first seven days, they’re probably gone. Cohort analysis is where you see this clearly: a table of users grouped by their signup week, with columns showing what percentage returned at 1 week, 2 weeks, 4 weeks, 8 weeks.
Feature adoption — Which features are actually getting used? Not “impressions” or “clicks”, but the percentage of active users who’ve completed the core action for a given feature at least once. Most products have two or three features that drive retention and a long tail of things nobody uses. Knowing which is which matters.
Activation — The percentage of new signups who hit your defined “activated” milestone within the first session or first week. Whatever your aha moment is, are people getting there?
Churn signals — Users who were active 14 days ago but haven’t logged in since. Features that show up in the sessions of churned users but not retained users. These are the early warning signs.
Building It Without a Data Engineer
The traditional path here is painful. You file a ticket with the data team, wait a week, get a Looker dashboard that almost answers your question but cuts things the wrong way, iterate via Slack for another week, and eventually build your own spreadsheet instead.
The alternative is connecting your product database directly to a dashboard tool and prompting your way to the answer.
With Infograph, the workflow is:
- Connect your data source — CSV export from Mixpanel or Amplitude, a Google Sheet with your product events, or a direct connection to Excel Online
- Type what you want to see: “Show me week 1 retention by signup cohort for the last 12 weeks”
- Watch it build
The prompting part sounds too simple to work. It isn’t. The AI understands what “retention cohort” means. It knows to group by signup week, calculate the return rate at each interval, and format it as a cohort grid. You don’t have to know SQL.
We’ve seen product managers go from “I don’t have this data” to “here’s the dashboard I’m presenting to the board” in under 20 minutes.
The Metrics Most PMs Forget
Time to second action — Not time to first login. The second meaningful action is a much better predictor of long-term retention than the first. If users sign up, do the onboarding flow, and never touch the core feature — that’s a different problem than users who hit the core feature but don’t come back.
Feature depth vs. breadth — Breadth is easy to measure (what percentage of users touched Feature X?). Depth is more interesting: of the users who used Feature X, how many used it more than once? More than five times? Regular, repeated usage of a feature is a much stronger signal than one-time exploration.
Power user concentration — What percentage of your activity comes from your top 10% of users? If it’s over 70%, you have a retention problem hiding behind healthy aggregate numbers. The averages look fine; the distribution tells a different story.
Cross-feature usage — Which features tend to be used together? This tells you something about product-market fit within your user base. The users who use Feature A and Feature B together probably have a different job-to-be-done than users who only use Feature A. They might be two different segments who need different things from you.
What Your Dashboard Should Look Like
A product analytics dashboard shouldn’t be 25 charts. The ones that work well have a clean hierarchy:
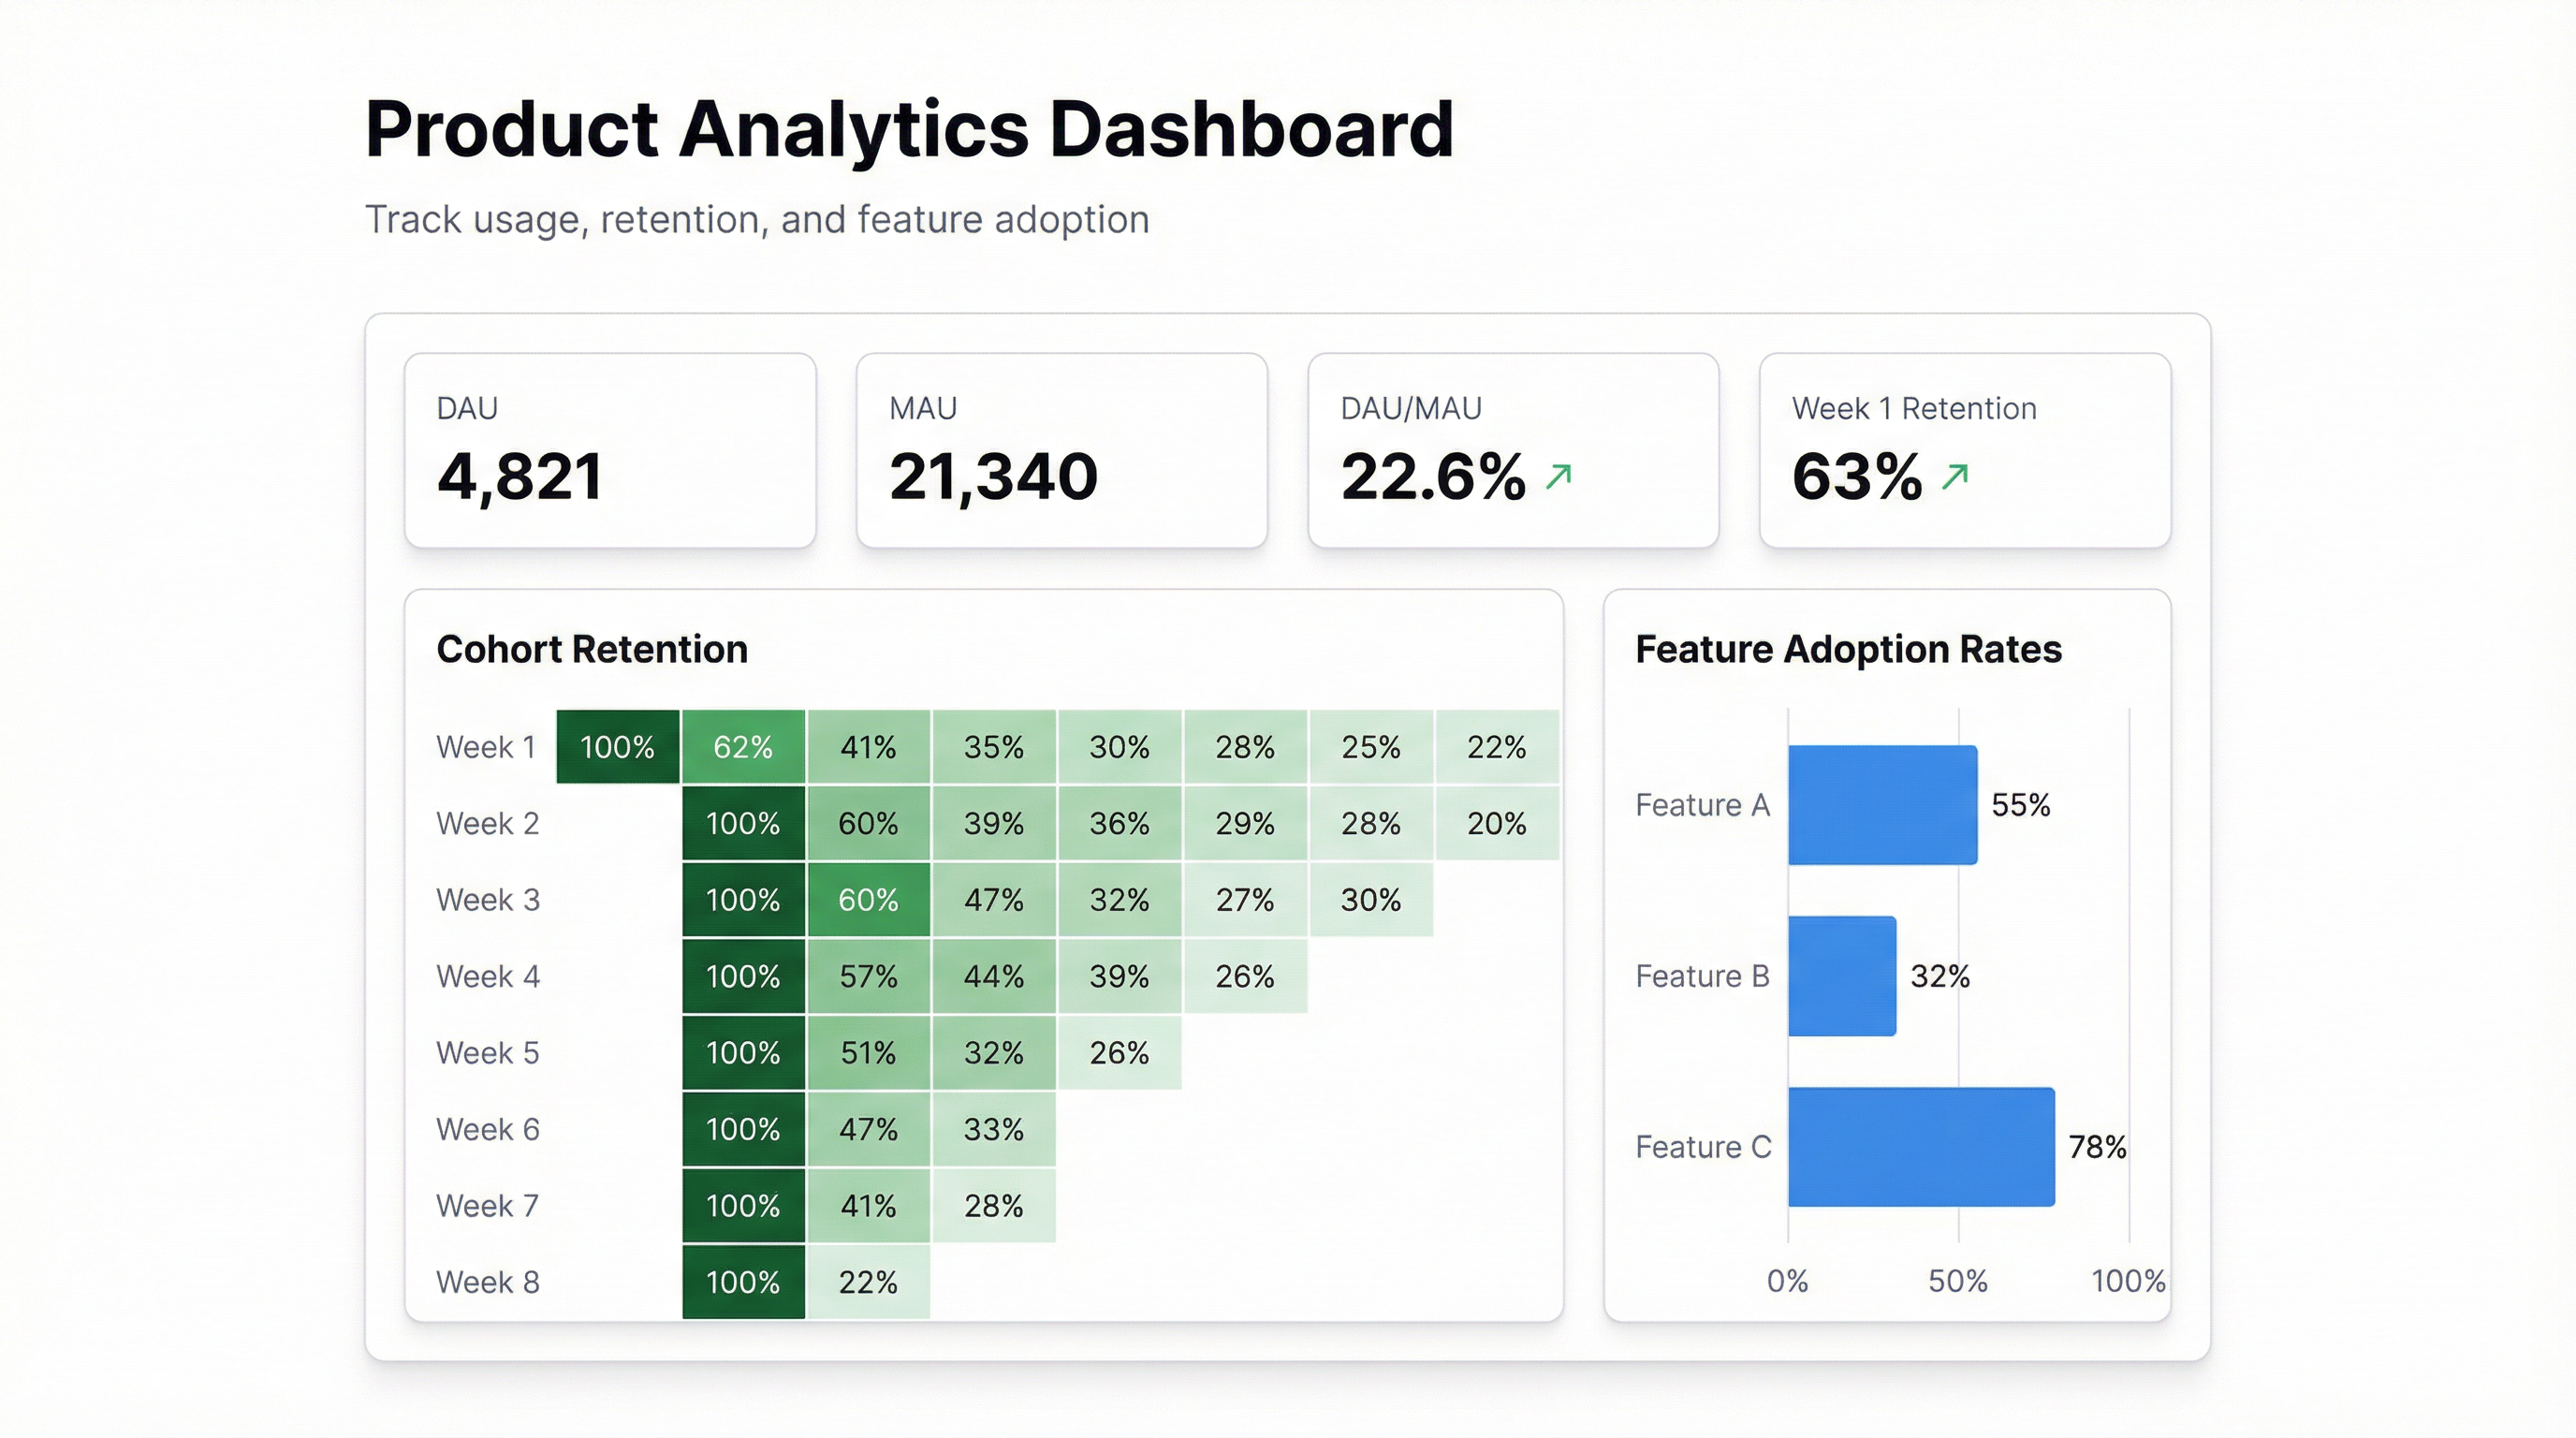
At the top, three or four headline numbers: DAU, MAU, DAU/MAU ratio, Week 1 retention. These are the vital signs. They tell you in five seconds whether to be concerned.
Below that, one primary chart — usually the retention cohort grid or a DAU trend over 90 days. This is where you spend most of your diagnostic time.
Then a secondary section for feature adoption and activation. These are drill-downs rather than top-line metrics.
At the bottom or in a side panel, anomalies and alerts: users who dropped off in the last 7 days, features with adoption below a threshold, cohorts with retention that’s meaningfully worse than average.
The dashboard should answer the question “is the product healthy?” in under ten seconds of looking at it. If it takes longer, there’s too much on it.
Getting Your Data Ready
Product analytics data tends to live in a few places:
Event exports from Mixpanel, Amplitude, or Heap — these tools export to CSV nicely. The columns are usually user ID, event name, event timestamp, and a properties JSON blob. You don’t need the full JSON blob for most dashboard purposes.
Google Sheets — a lot of early-stage teams track product events in Sheets because it’s easy to pipe to from Segment or Rudderstack. This is actually great for Infograph because you can connect a live Google Sheet and get a dashboard that updates as new events come in.
Excel exports — same story, works fine. The Infograph Excel connector handles the column detection automatically, including the type inference for dates and IDs.
The one thing to do before connecting: make sure your date columns are formatted consistently. Mixed date formats (some cells “March 1, 2026”, others “2026-03-01”) will cause the AI to misread the time axis, and your retention curves will look wrong.
Building the Dashboard
Once your data is connected, prompt specifically:
“Show me DAU over the last 90 days as a line chart” — works perfectly.
“Give me a cohort retention table, grouping users by the week they signed up, showing percentage who returned at week 1, 2, 4, 8” — also works.
“Feature adoption rate for [Feature A, Feature B, Feature C] as a horizontal bar chart, sorted by adoption descending” — yes.
“List the users who were active in week ending March 1 but haven’t logged in since” — this is more of a segment query than a dashboard visual, but you can export it as a table and filter from there.
The thing that surprises most PMs the first time: you can ask follow-up questions. The dashboard isn’t static. If the retention cohort looks weird for signups in week 6, you can type “break down week 6 retention by acquisition channel” and it adds the filter.
Who This Is For
Product managers at companies where the data team is slow, small, or otherwise occupied. Companies where Mixpanel or Amplitude cost more than you want to spend right now. Teams that want to answer questions faster than the BI tool allows.
If you’re already deeply embedded in Amplitude and the data team has a dedicated dashboard for you, you probably don’t need this. But if you’ve ever opened a spreadsheet because it was faster than waiting for a ticket to get picked up — this is for you.
Start with one question you can’t answer right now. Connect your data. Type the question. See what comes back.


