Most data visualization advice is either too abstract (“tell a story with data”) or too prescriptive (“never use pie charts”). The best practices that actually change how you work sit somewhere in between: concrete enough to apply today, principled enough to cover cases you haven’t encountered yet.
Here are the ones worth knowing.
Choose Charts Based on the Question, Not the Data
The most common visualization mistake: picking a chart type because it looks interesting, not because it answers the right question.
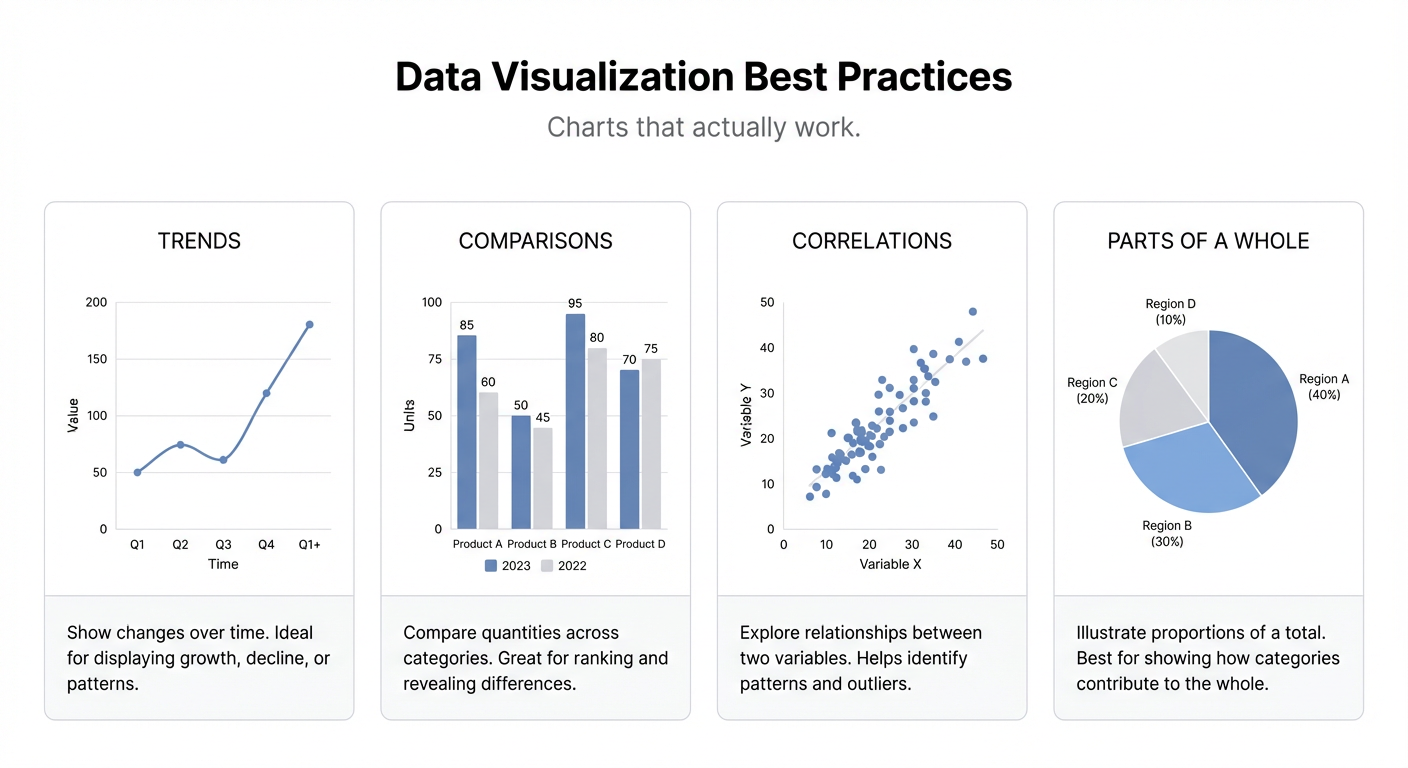
Every chart type has a job:
- Line chart — change over time. The x-axis is always time.
- Bar chart — comparison between discrete categories. Use horizontal bars when you have more than 7 categories or long labels.
- Scatter plot — relationship between two continuous variables. Is there a correlation? How strong?
- Pie/donut chart — parts of a whole. Only works if there are 2-4 segments and the segments are meaningfully different in size. If everything is roughly equal, a bar chart communicates it better.
- Histogram — distribution. How is a single variable spread across a range?
- Heatmap — patterns across two dimensions. Great for time-of-day/day-of-week patterns or geographic density.
Before you build a chart, ask: what specific question is this answering? If you can’t answer that in one sentence, the chart probably shouldn’t exist.
Start Axes at Zero (With One Exception)
Truncated y-axes are one of the most common ways charts mislead. A bar chart that starts at 85 instead of 0 makes a 3% difference look like 50%.
The rule: bar and column charts always start at zero. The length of a bar represents quantity, and length only communicates quantity correctly when it starts at zero.
The exception: line charts showing a narrow range of values where starting at zero would hide all the meaningful variation. If you’re showing stock price movement over a day, starting at zero makes the entire chart a flat line at the top. In this case, starting at a non-zero baseline is fine — but label the axis clearly.
Remove Chart Junk
Gridlines, borders, 3D effects, drop shadows, background fills, and legend boxes all add visual noise without adding information. Every element that doesn’t carry information takes attention away from the elements that do.
Edward Tufte’s concept of “data-ink ratio” still applies: maximize the proportion of ink (or pixels) dedicated to data. Remove:
- Heavy gridlines → use faint ones or none
- Thick axis lines → remove or make thin
- 3D effects → always remove; they distort perception
- Legend boxes with heavy borders → remove the border
- Decorative background fills → white or light grey only
What you’re left with after removing all the noise is almost always clearer than what you started with.
Use Color to Communicate, Not to Decorate
Color is one of the most powerful tools in data visualization and one of the most abused.
Bad color use: assigning a different color to every bar in a bar chart just to make it look “colorful.” This implies that the categories are meaningfully different in a way that color should distinguish — but if all the bars are the same type of thing, same color communicates that correctly.
Good color use:
- Highlight one bar or line that’s the focus (use a distinct color for the important one, grey for the rest)
- Show positive/negative with green/red — but ensure colorblind accessibility (use blue/orange instead)
- Use a sequential color scale for continuous values (light to dark as values increase)
- Use a diverging scale when values go both above and below a meaningful midpoint
Pick a palette and stick to it across your entire dashboard. Consistent colors build a visual vocabulary — viewers learn that blue means “target” and orange means “actual” without reading labels.
Label Directly When Possible
Legends require eye movement: look at chart → find legend → match color → look back at chart. For any chart with fewer than 4 series, direct labeling is almost always better.
Label the lines directly at their endpoints. Remove the legend entirely. This simple change typically makes charts 20-30% easier to read.
The same applies to data labels on bar charts. If the exact value matters, put it directly on the bar. If the relative comparison matters more than the exact value, let readers read the axis instead.
Design for the Viewing Context
A chart that looks great in a presentation breaks down as a dashboard widget. A dashboard widget designed for a large monitor becomes unreadable on mobile.
Think about where and how your visualization will be viewed:
- Presentation slide: bigger fonts, fewer data points, high contrast
- Dashboard widget: compact, skimmable, key number prominent
- Printed report: black-and-white safe, no reliance on color alone
- Mobile view: strip down to one key insight per view, no horizontal scrolling
The Best Visualization Is the One That Gets Acted On
All of these practices serve one goal: making the data clear enough that the right person takes the right action. A technically perfect chart that nobody looks at is worthless. A simple, slightly imperfect chart that’s visible at a morning standup and drives decisions is doing its job.
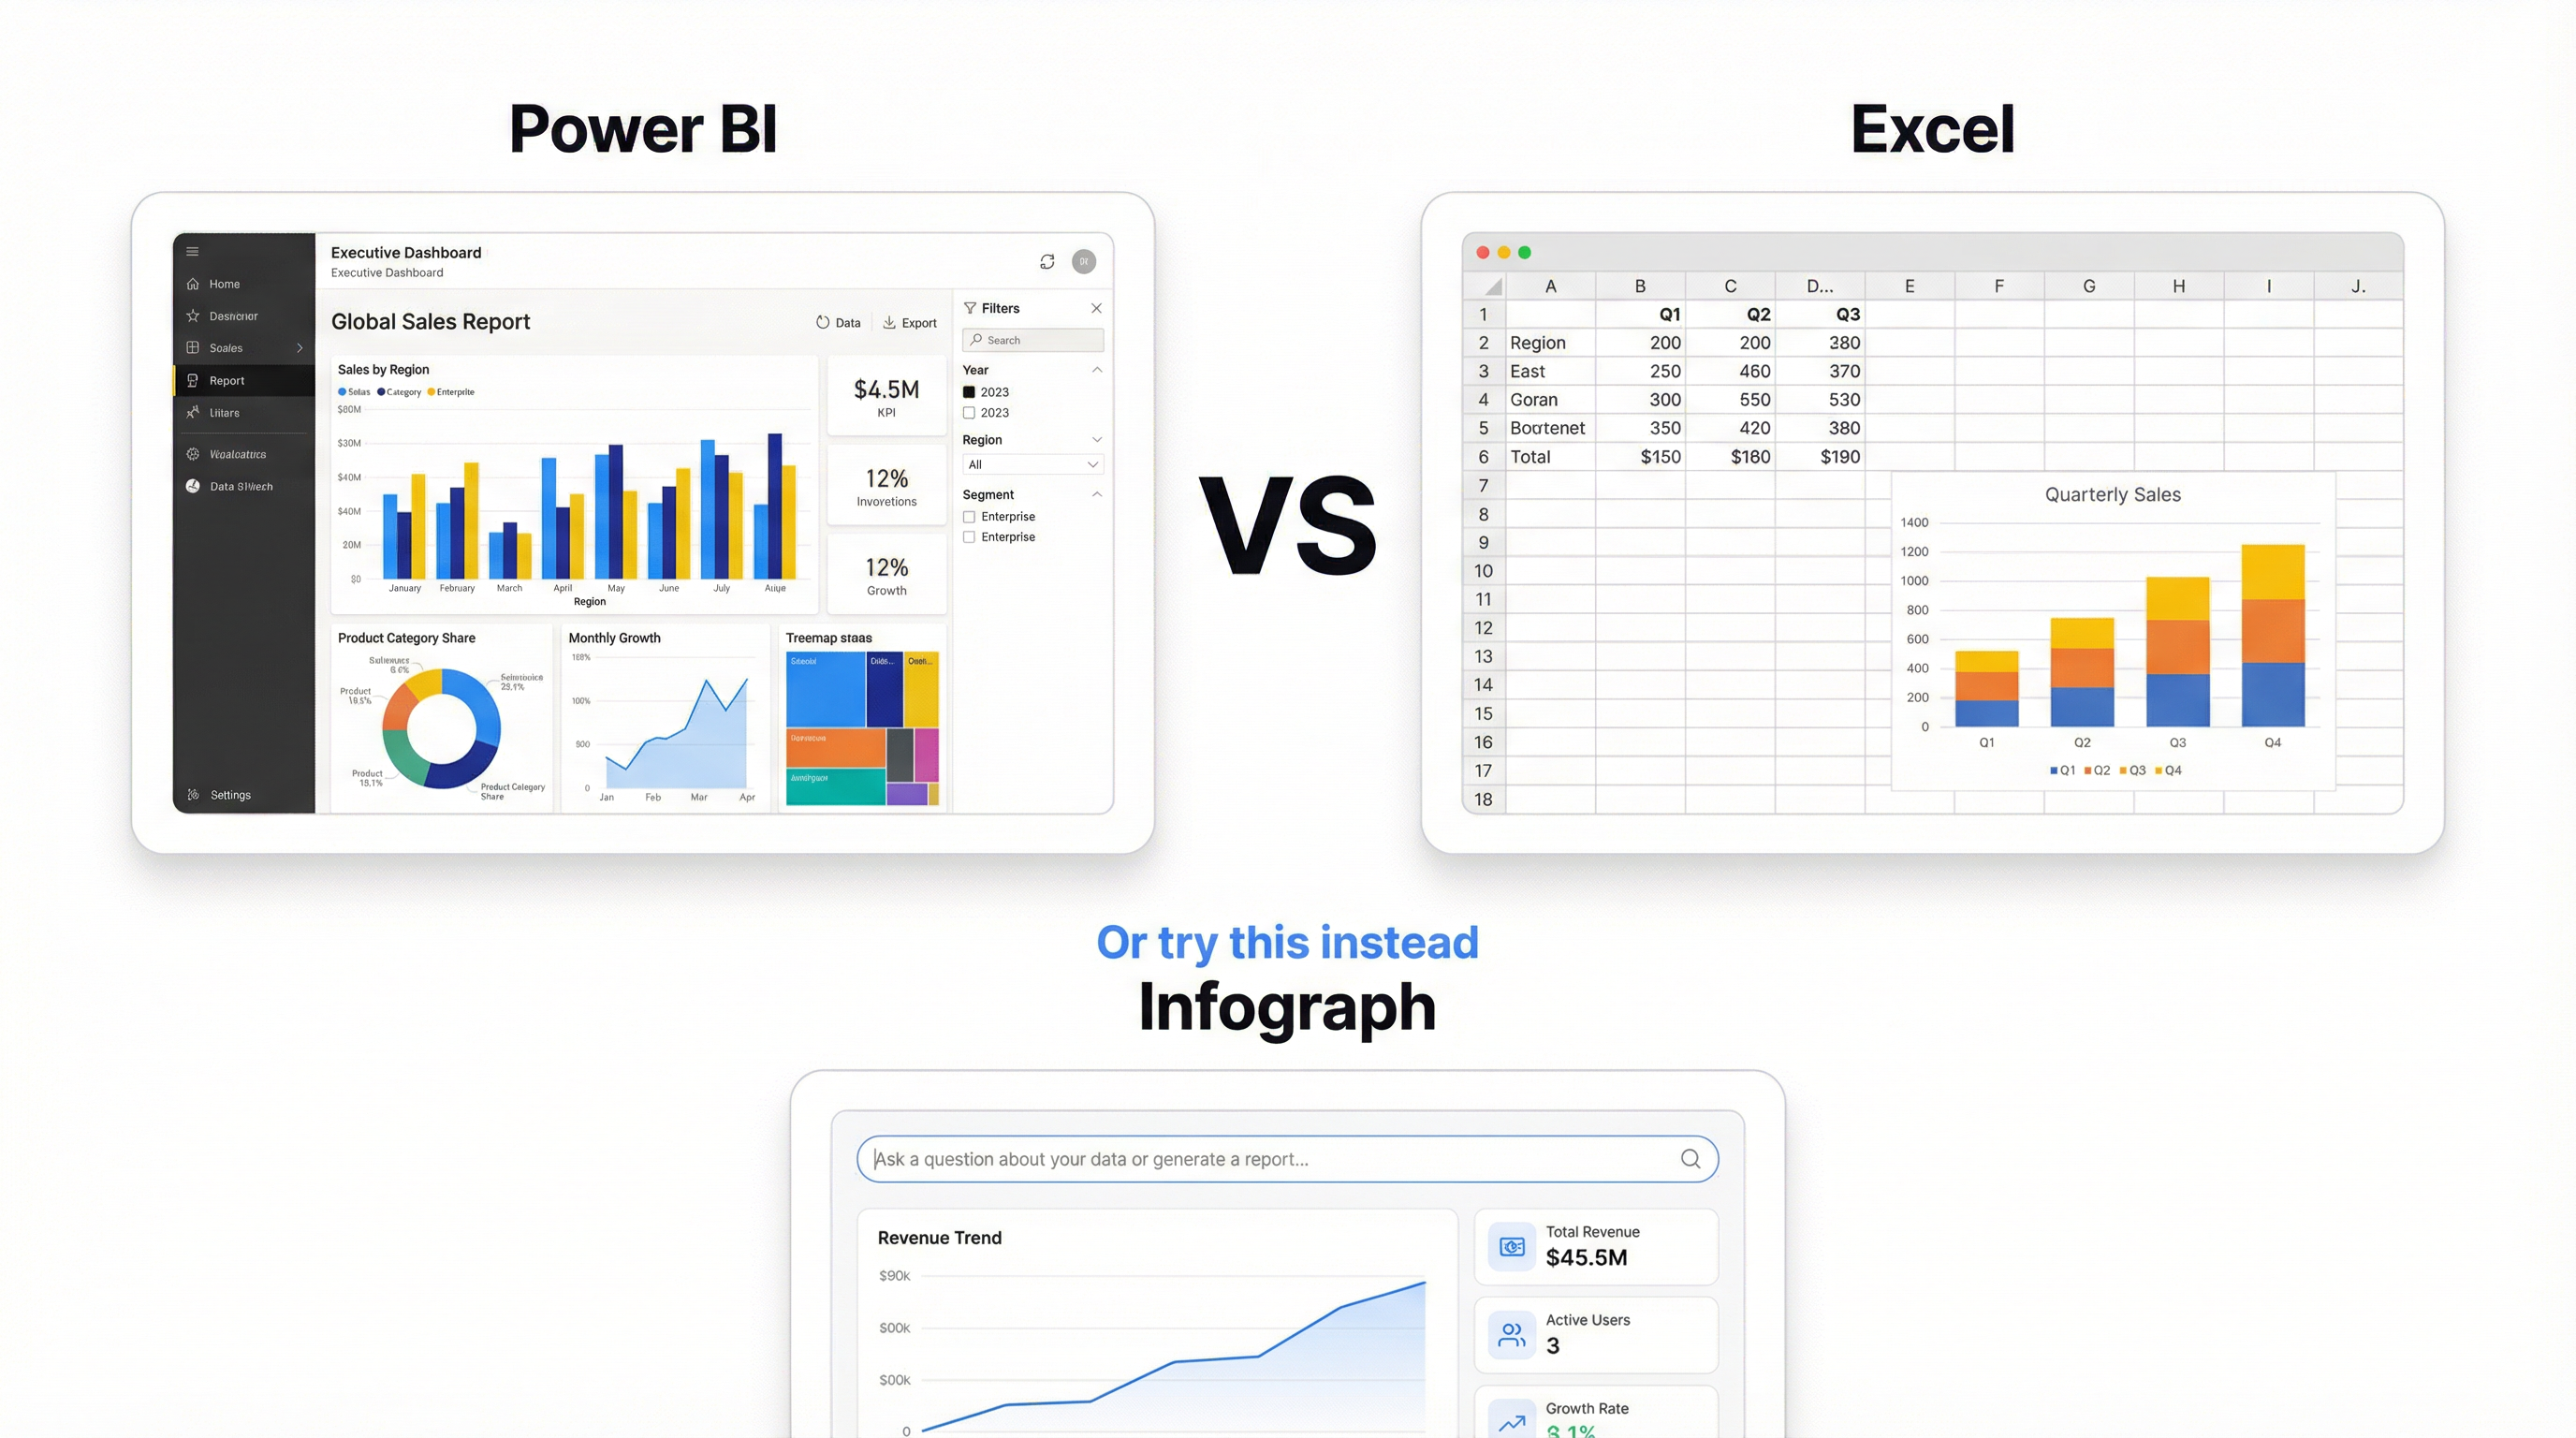
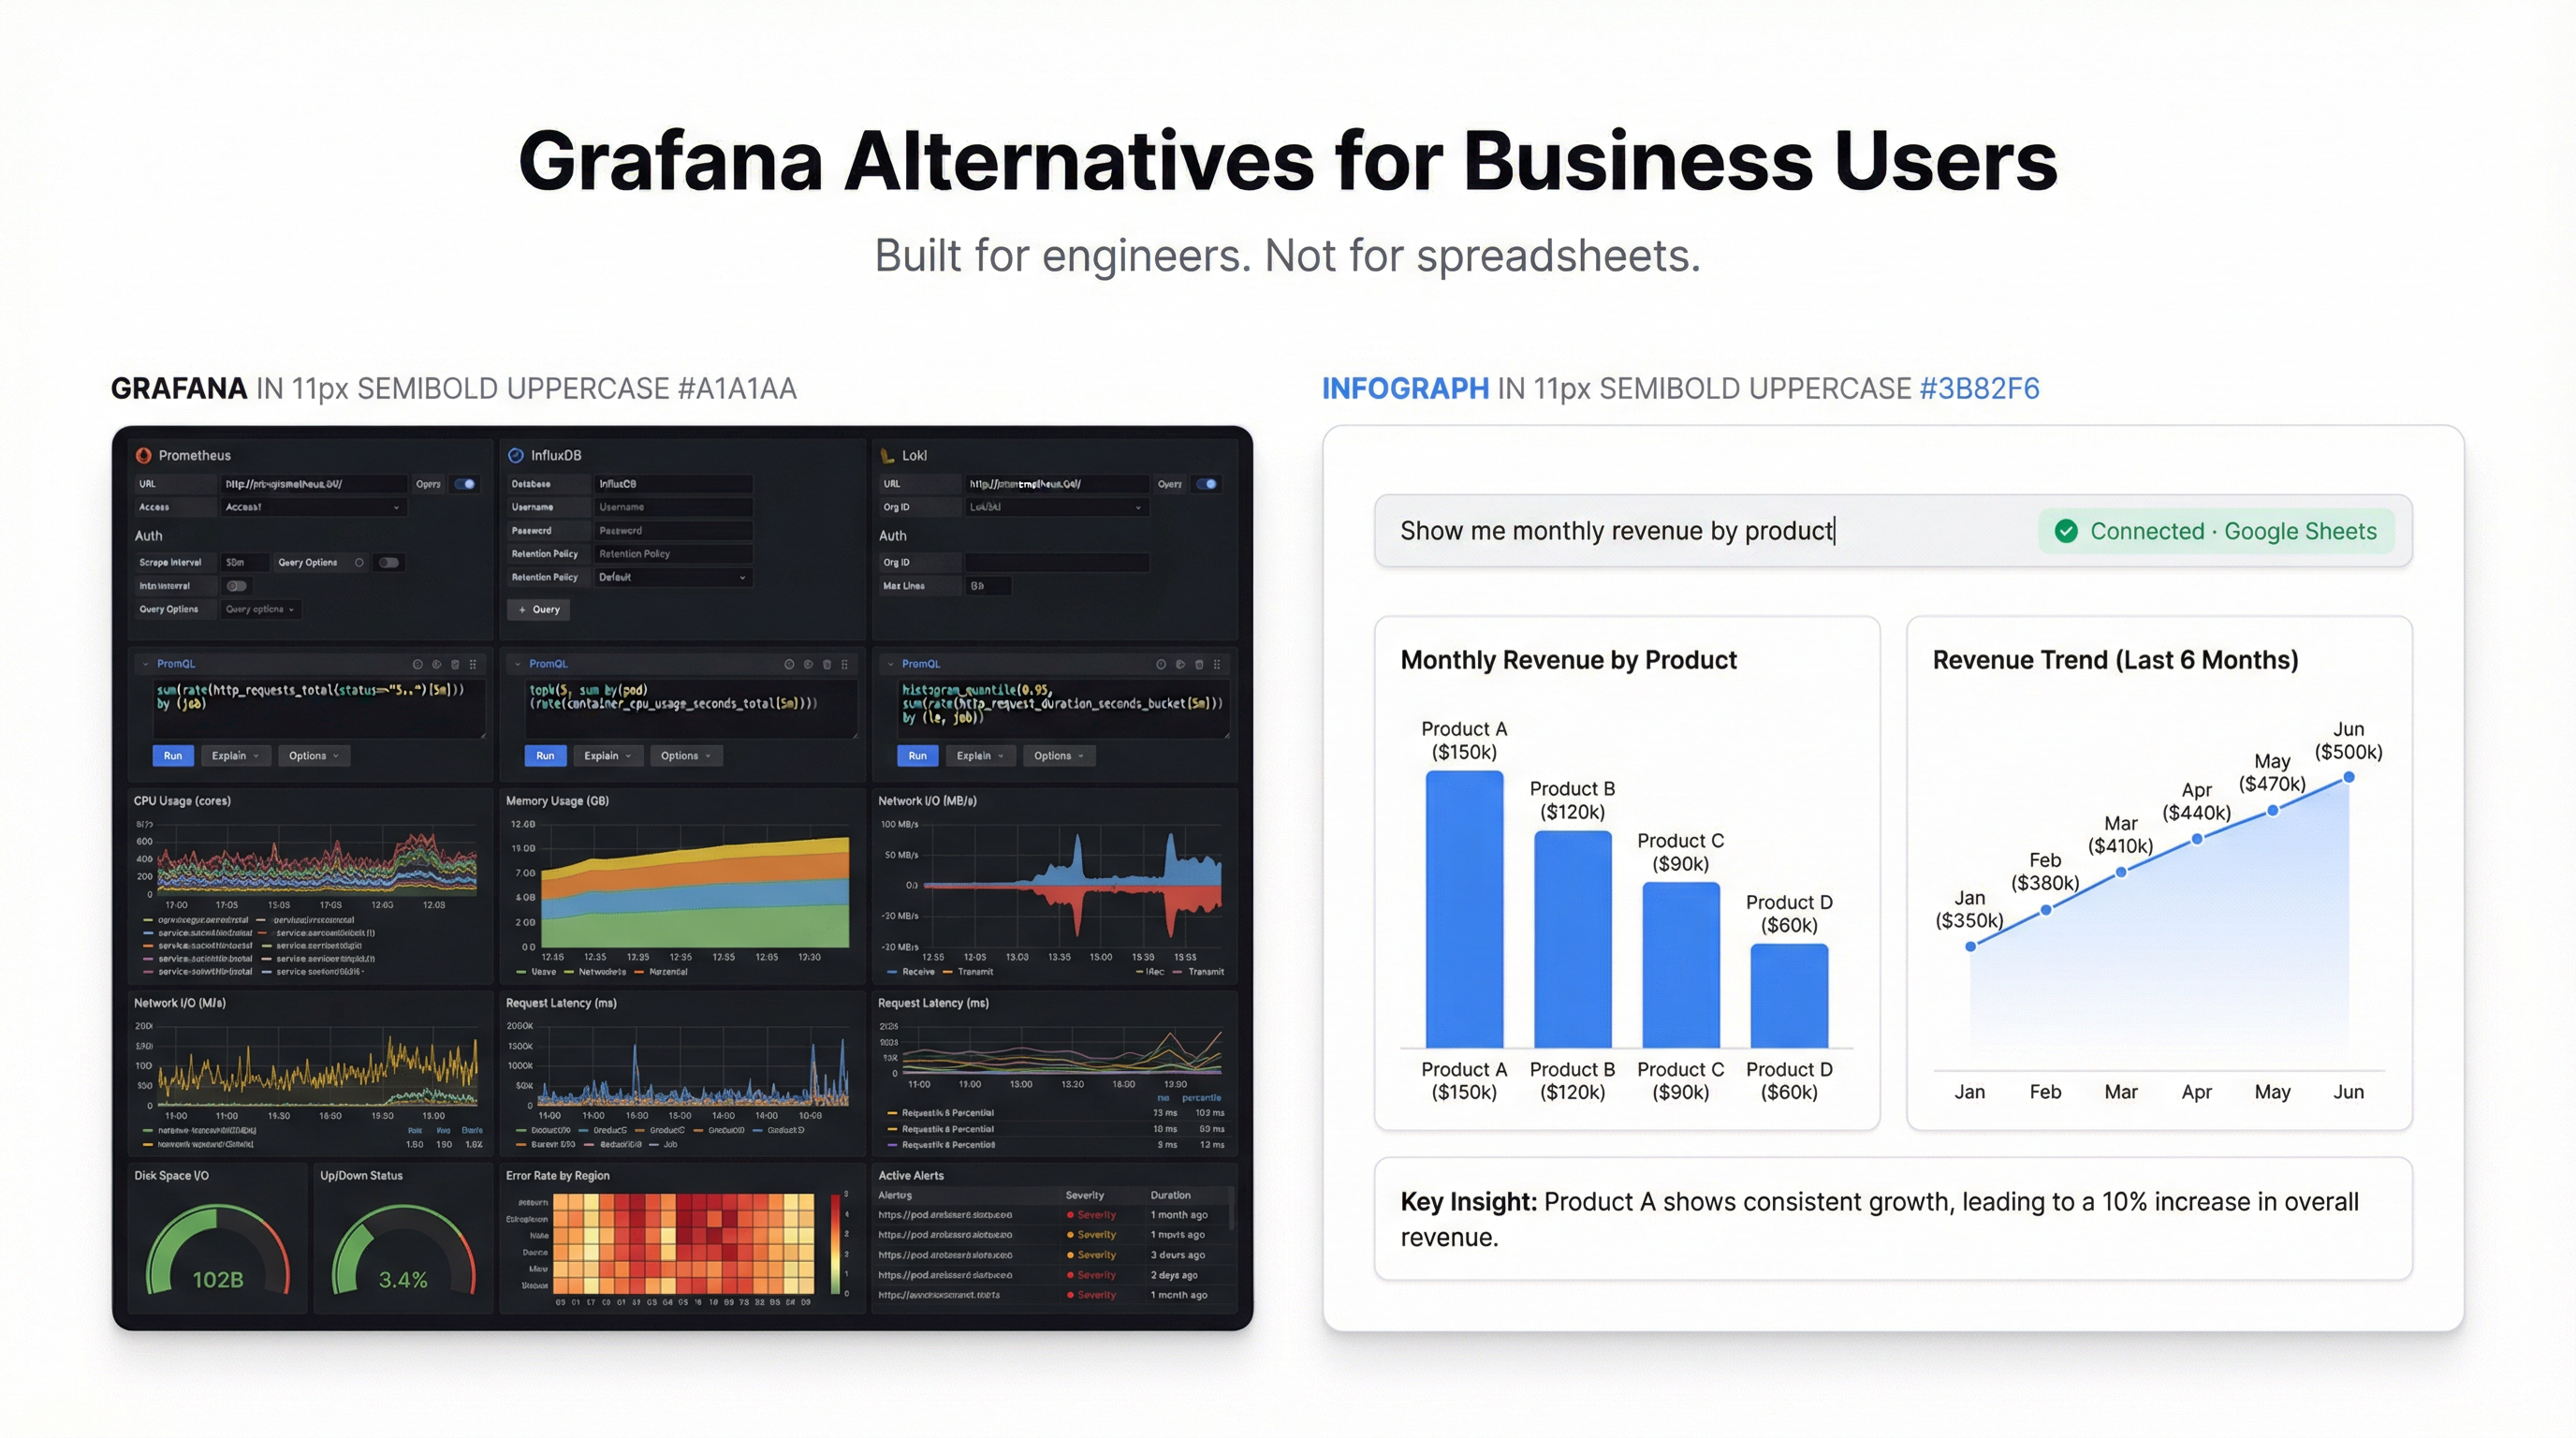
Build dashboards that people actually look at. Put them where decisions happen. Update them automatically so they’re always current.
Infograph builds dashboards from plain-language prompts — connect your data source, describe what you want to see, and the dashboard appears. No chart configuration. No axis formatting. No manual updates.
When the visualization does its job, you stop thinking about the chart and start thinking about the data.