Your project cost tracker is buried in Excel. Your site supervisor’s safety log is in a separate sheet. Subcontractor progress updates come in via email, and you’re manually pulling it all together every Monday morning before the owner call.
That’s not a system. That’s a fire drill you run every week.
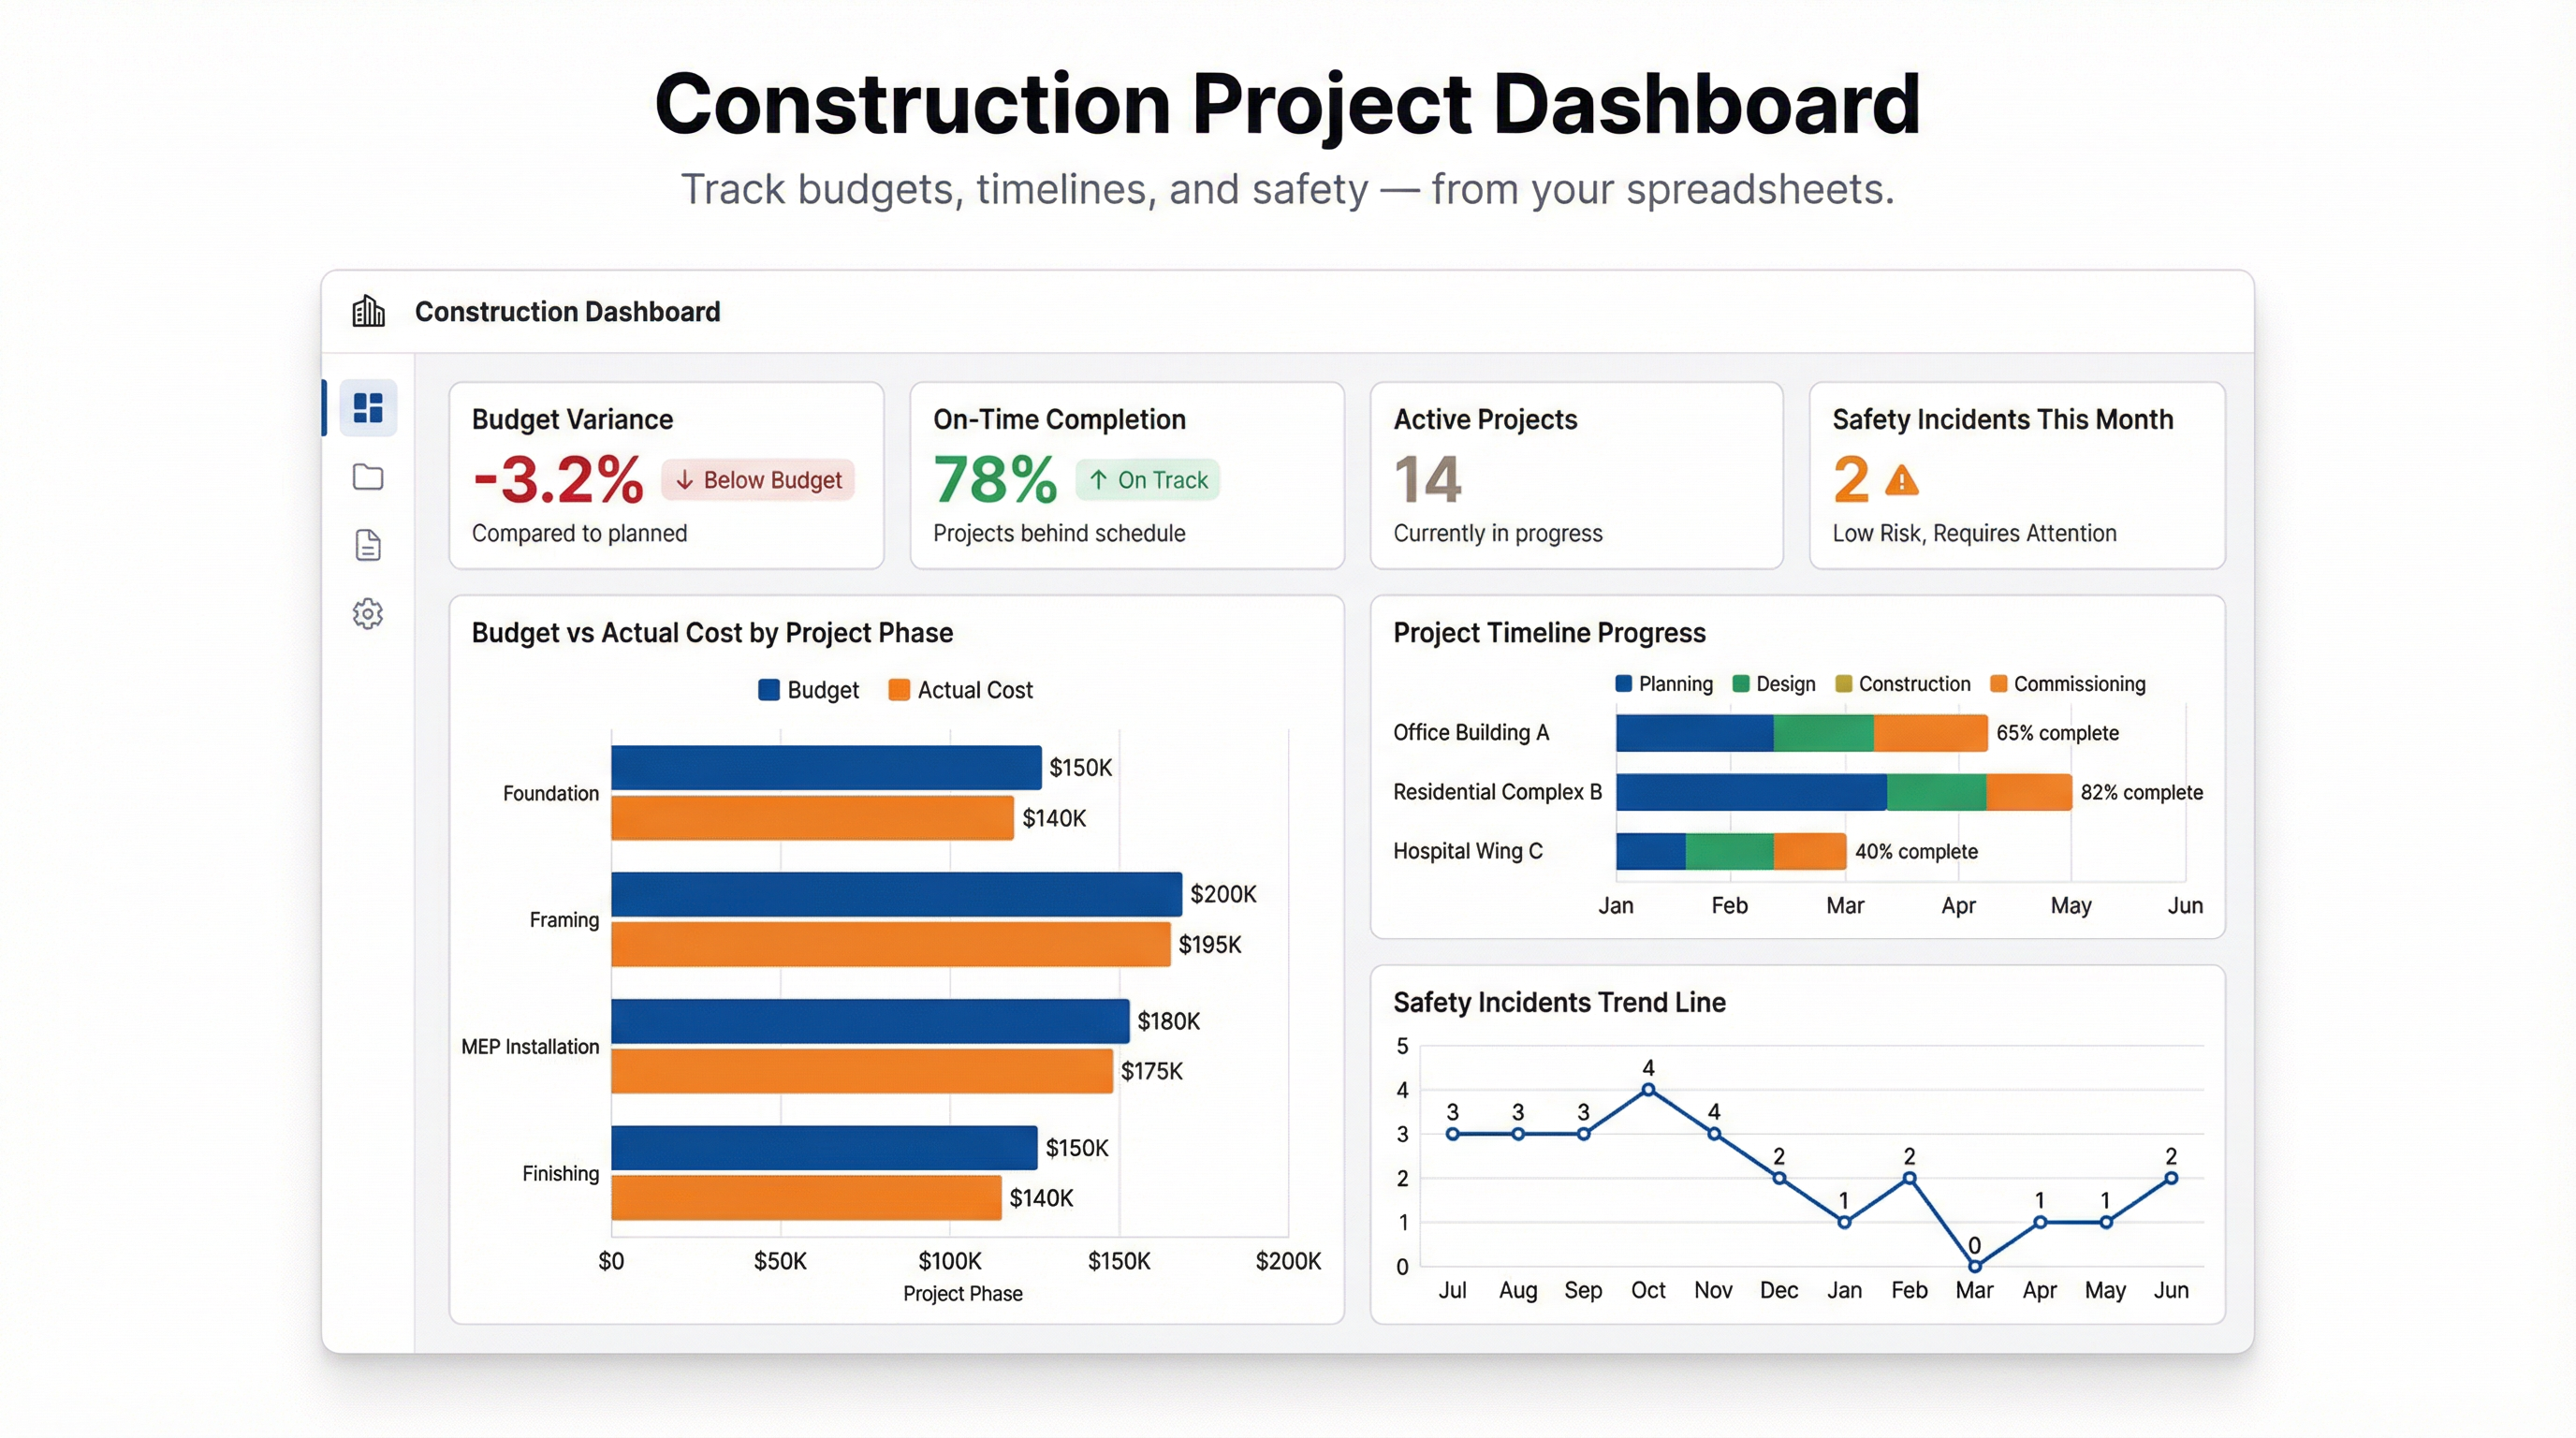
A construction dashboard puts all of it in one place — budget vs actuals, project completion percentages, labor productivity, safety incidents, and subcontractor performance. Not next week. Right now, from the spreadsheets you already have.
What Goes on a Construction Dashboard
The right KPIs depend on your role. A project manager cares about budget burn and schedule variance. A site supervisor wants labor productivity and safety incidents. An owner or exec wants high-level completion status across all active projects.
Here’s what typically matters most:
Budget vs Actuals Track committed spend against your original budget, broken down by project phase: sitework, foundation, framing, MEP, finishes. If Phase 3 framing is running 12% over, you want to know that in week 6, not week 12.
Project Completion % Percent complete by phase, rolled up to overall project completion. Compare planned completion against actual completion to surface schedule slippage before it compounds.
Labor Productivity Hours worked vs hours budgeted per trade. If your concrete crew is burning 20% more hours than planned, it’s showing up on this chart. Catch it early.
Safety Incidents Total recordable incidents, near-misses, and days without incident. Safety dashboards aren’t bureaucratic — they’re accountability tools. A trend line that’s climbing is a problem that needs a conversation.
Subcontractor Performance On-time delivery rate, change order count, punch list items outstanding per sub. Who’s holding up the schedule? This number tells you.
Material Costs Actual material spend vs purchase orders. Flag overruns on major line items — lumber, concrete, steel — before they blow the phase budget.
Types of Construction Dashboards
Not every project needs every metric visible at once. Build around the question you’re trying to answer.
Project Tracking Dashboard The day-to-day operations view. Gantt-style progress bars by phase, completion percentages, active tasks, milestone status. Who’s on track, who’s behind, what’s blocked. This one lives on the project manager’s screen.
Financial Dashboard Budget burn by phase, cost variance, cash flow timing, and projected total cost at completion (TCAC). Useful for owner updates, bank draws, and monthly financials.
Safety Compliance Dashboard Incident counts, OSHA recordable rates, near-miss trends, safety inspection scores by site. If you’re managing multiple projects, this view rolls it up across all sites in one place.
Resource Allocation Dashboard Labor hours by crew and trade, equipment utilization, subcontractor capacity. Useful when you’re running three projects at once and trying to avoid pulling the same crew in two directions.
Building a Construction Dashboard with Infograph
You don’t need a BI analyst or a custom software build. If your data is in a spreadsheet — Excel, Google Sheets, CSV — you can have a working dashboard in minutes.
Here’s how a typical project cost tracking sheet turns into a live dashboard.
Step 1: Get Your Data in Shape
Your project cost tracker probably has columns like: Phase, Budget, Actual Cost, % Complete, Start Date, End Date, Crew Hours Budgeted, Crew Hours Actual.
It doesn’t need to be perfect. Infograph handles messy headers and mixed formats. But cleaner data means faster, more accurate results.
Export as CSV, or connect your Google Sheet or Excel Online file directly — no download needed.
Step 2: Connect Your Data
Go to app.infograph.ai and create a new dashboard. Upload your CSV or Excel file, or click “Connect” to link a live Google Sheet or Excel Online document.
Live connections mean your dashboard updates automatically as the spreadsheet changes. Your site supervisor updates labor hours on Friday — the dashboard reflects it before your Monday call.
Step 3: Describe What You Want
This is where Infograph is different. You don’t drag and drop charts or configure axes manually. You type what you want, plain language.
Try prompts like:
- “Show budget vs actual cost as a bar chart grouped by project phase”
- “Create a progress tracker showing % complete for each phase with a comparison to planned completion”
- “Show a trend line of safety incidents by week”
- “Display KPI cards for total budget, total spend to date, budget variance, and overall project completion %”
The AI reads your column names and data structure, builds the visuals, and assembles the layout. If it’s not quite right, edit the prompt. Takes seconds to regenerate.
Step 4: Share It
When the dashboard is ready, hit Publish. Share the link with your owner, project team, or exec — or keep it internal to your organization. You control who sees what.
If the underlying spreadsheet is connected live, anyone viewing the dashboard sees current data without you doing anything. No more “can you send me the latest version.”
Real Example: Cost Tracking Sheet → Dashboard
Here’s what this looks like in practice.
Input: An Excel file with 9 project phases, budget and actual cost per phase, start/end dates, budgeted vs actual labor hours, and a list of safety incidents with dates.
Output from Infograph:
- Bar chart: Budget vs Actual Cost by phase. Phase 4 (MEP rough-in) is $47K over budget, highlighted automatically.
- Progress bars: Planned vs actual completion % by phase. Foundation and framing are complete. Mechanical is 60% complete but 3 weeks behind planned schedule.
- KPI cards: Total Budget $2.4M | Spent to Date $1.1M | Budget Variance -4.1% | Overall Completion 52%
- Safety trend line: 3 incidents in January, 1 in February, 0 so far in March.
That view — which used to take 45 minutes of manual formatting every Monday — generates in under 2 minutes. And it updates automatically every time someone edits the source file.
Common Mistakes to Avoid
Tracking too many KPIs at once. A dashboard with 20 charts isn’t useful. Pick the 6-8 numbers that drive decisions, and build around those.
Using stale data. If your dashboard isn’t connected to a live source, it’s only as good as the last upload. Connect Google Sheets or Excel Online so updates happen automatically.
Building one dashboard for everyone. The owner wants project completion and budget summary. The site supervisor wants daily labor hours and safety. Build separate views for separate audiences.
Ignoring variance. Budget and schedule variance are early warning signals. If you’re tracking actuals without comparing them to plan, you’re missing the point.
Who This Is For
Construction dashboards work for any project where data lives in spreadsheets and reporting is still a manual process. That covers a lot of ground: residential developers, commercial GCs, specialty subcontractors, infrastructure project managers, owner’s reps.
If you’re managing more than two active projects and spending time every week pulling reports together, a dashboard pays for itself in the first week.
Get Started
Your spreadsheets have everything you need. Connect them to Infograph and you’ll have a working construction dashboard before your next site visit.
No setup fees. No data analyst required. No waiting.