Most supply chain problems are invisible until they become emergencies. A shipment is late — but you find out when a customer emails, not when it left the port. Inventory is running low on a bestseller — but you find out when someone tries to place an order and can’t.
A supply chain dashboard doesn’t make those problems disappear. It just surfaces them early enough to do something about them.
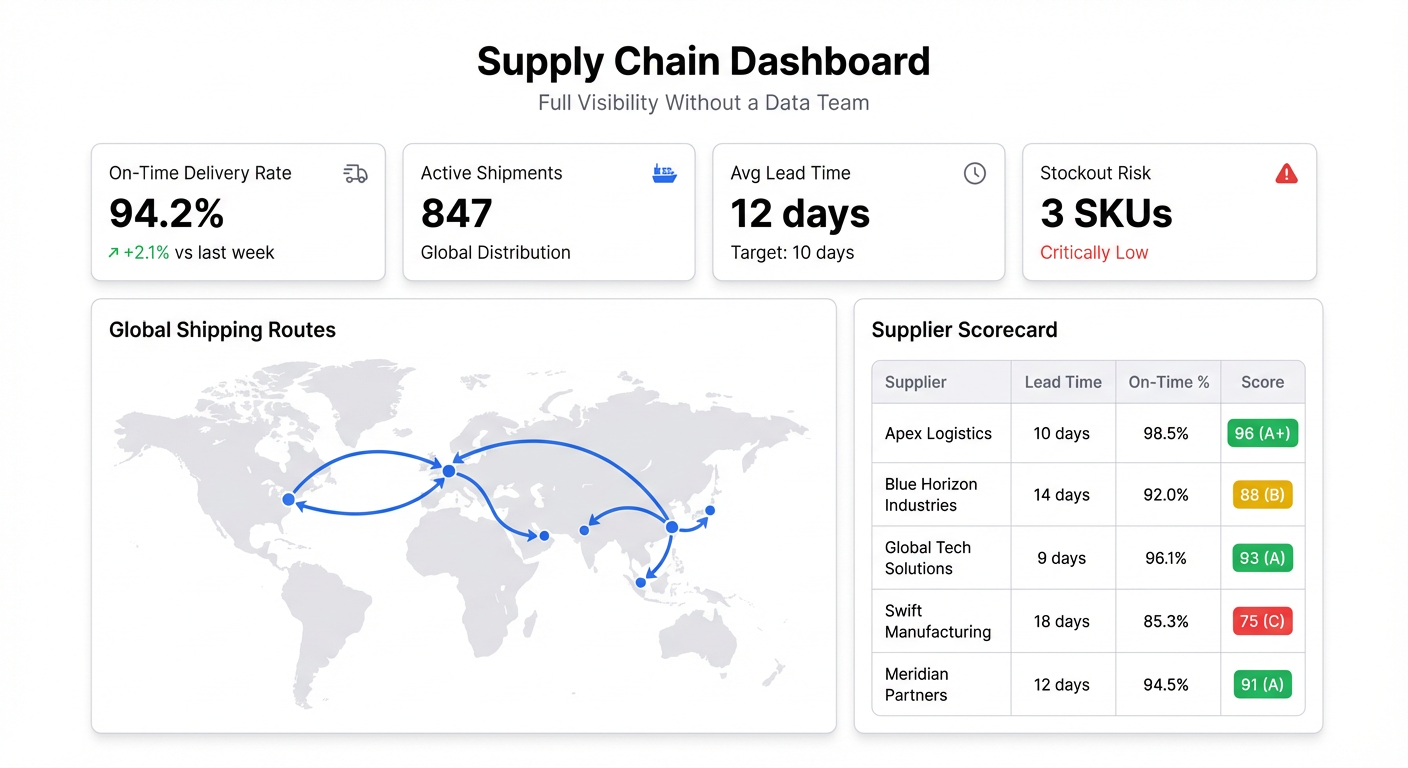
What a Supply Chain Dashboard Actually Needs to Show
The data already exists. Your warehouse system knows inventory levels. Your shipping carrier has tracking data. Your supplier has lead times. The problem is that this data lives in four different places, and no one has time to cross-reference them every morning.
A useful supply chain analytics dashboard brings it together:
- Inventory levels by SKU — what you have, where, and how many days of cover that represents
- Reorder alerts — what’s approaching minimum stock thresholds
- Supplier lead times — which suppliers are running on schedule and which are consistently late
- Open purchase orders — what’s been ordered, what’s in transit, expected delivery dates
- Order fulfillment rate — what percentage of orders are shipping on time
- Logistics delays — shipments that are past expected delivery without a status update
Six metrics. Each one answers a question your operations team is currently answering manually, by logging into different systems.
Building a Supply Chain Dashboard Without Engineers
The fastest path to a supply chain dashboard is through your existing spreadsheets. Most operations teams are already tracking this data — it’s just in Excel files, Google Sheets, or CSV exports from their ERP or WMS.
Step 1: Pull Your Data Into One Place
Start with whatever you already have. Common sources:
Inventory export from your warehouse management system. Most WMS tools have a CSV export or a built-in Sheets integration. Pull current stock levels, SKU details, and location data.
Open PO report from your procurement system or ERP. This usually includes supplier name, order date, expected delivery date, and line item quantities.
Shipment tracking data from your 3PL or carrier. If they don’t have an API, most carriers let you export tracking events as a spreadsheet.
Pull each into a Google Sheet. Three tabs, one workbook — that’s usually enough to start.
Step 2: Connect to Infograph and Describe Your Dashboard
Sign in to Infograph, create a new dashboard, and connect your Google Sheet. Then describe what you need:
“Show current inventory levels by SKU as a table, sorted by days of stock remaining. Highlight anything under 14 days in red. Add a bar chart showing units on order by supplier.”
Infograph reads your column headers and builds it. If your inventory export has columns like “Current Stock,” “Daily Sales Rate,” and “SKU Name” — it’ll figure out the days-of-cover calculation. You don’t write formulas. You describe what you want.
For supplier performance:
“Add a chart showing average lead time by supplier over the past 6 months, compared to their committed lead time. Show which suppliers are running behind.”
For a logistics view:
“Table of all open shipments with expected delivery date. Flag any shipment that’s more than 3 days past expected delivery.”
Each prompt builds on the last. Within 20 minutes you have a dashboard that would have taken a BI analyst days to build.
Step 3: Keep It Live
The dashboard is only useful if the data is current. Connect your Google Sheets directly to Infograph rather than uploading a one-time file — when the sheet updates, the dashboard updates.
If your WMS exports to Sheets on a schedule, or if your team updates the tracking file daily, the dashboard reflects those updates automatically. No one needs to remember to refresh.
For teams on the Pro plan, you can share the dashboard with your whole operations team, set access controls, and publish a version for your 3PL or supplier partners to view.
Who Uses Supply Chain Dashboards This Way
E-commerce brands tracking inventory across multiple warehouses. They want to know which SKUs are running low at which location before a stockout happens, not after.
Importers and distributors managing lead times from overseas suppliers. When a container is late, they need to know which downstream orders are affected — fast.
Operations managers at startups who don’t have a dedicated data team. They’re already maintaining spreadsheets. A dashboard makes those spreadsheets readable to the rest of the company.
3PL clients who want to give their clients visibility into their inventory without giving them direct WMS access. A branded dashboard link is cleaner than teaching clients to use your internal system.
The pattern is the same across all of them: data that exists, but isn’t visible. The dashboard is just the window.
The Free Tier
One dashboard, no credit card required. If your supply chain data fits in a spreadsheet — and for most small and mid-size operations, it does — you can build and share a full inventory dashboard on Infograph’s free plan.
The Pro plan ($19.99/month) adds live Google Sheets connections, five dashboards, and more AI credits for building complex views.


