Your store is generating data constantly — orders, sessions, abandoned carts, product performance, customer lifetime value. The question is whether you’re actually using it, or just looking at the top-line revenue number and hoping for the best.
Most ecommerce operators fall into the second camp. Not because they don’t care about the data, but because turning it into something useful takes time they don’t have.
Here’s how to build an ecommerce dashboard that gives you the picture you need — without spending a week on it.
What your ecommerce dashboard should show
The mistake most people make is starting with “what data do I have?” instead of “what decisions do I need to make?”
The decisions that drive an ecommerce business are pretty consistent:
- Which products should I stock more of, and which should I cut?
- Where is my traffic coming from and what’s converting?
- Am I acquiring customers profitably?
- What does repeat purchase behavior look like?
- Where are people dropping off in the purchase flow?
Build your dashboard to answer those questions. Everything else is noise.
The metrics worth tracking
Revenue by channel — organic search, paid, email, social, direct. Not just total revenue. You need to know where growth is coming from so you can put more into what’s working.
Conversion rate — overall, and by source. A 1% conversion rate on organic traffic that you’re not paying for is very different from a 1% conversion rate on paid ads that cost $5 per click.
Average order value — trend over time. If AOV is dropping, your product mix or promotions are shifting in a way you need to understand.
Customer acquisition cost — total marketing spend divided by new customers acquired. If this number is growing and LTV isn’t, you have a problem.
Repeat purchase rate — what percentage of customers buy again? For most ecommerce businesses, the second purchase is where the real margin is. If repeat rate is low, retention is your priority.
Top products by revenue and by margin — these are often different lists. Know which products are actually profitable, not just popular.
Cart abandonment rate — if 70% of people who add to cart don’t complete the purchase, that’s a massive recovery opportunity.
Getting the data
Most ecommerce platforms — Shopify, WooCommerce, BigCommerce — have decent built-in reporting. The problem is that it’s siloed. Your platform shows you order data, but not how those orders correlated with your email campaigns. Your Google Analytics shows you traffic, but not what those visitors bought.
The practical approach:
Export from your platform. Shopify and WooCommerce both export order-level data as CSV. This gives you product, revenue, customer, and channel data.
Export from your ad platform. Google Ads and Meta Ads both export campaign performance data. Download weekly or monthly.
Combine in Google Sheets. If you’re doing this manually, a shared Google Sheet where someone pastes in the weekly numbers is fine for most teams under $5M revenue. It’s not glamorous, but it works.
Connect the sheet to your dashboard. With Infograph, connect your Google Sheet as a live data source. When you update the sheet, the dashboard updates automatically. You can also upload CSV exports directly if you prefer.
Then describe what you want: “Show me revenue by channel as a bar chart, conversion rate by source, top 10 products by revenue, and repeat purchase rate trend.” The AI builds it.
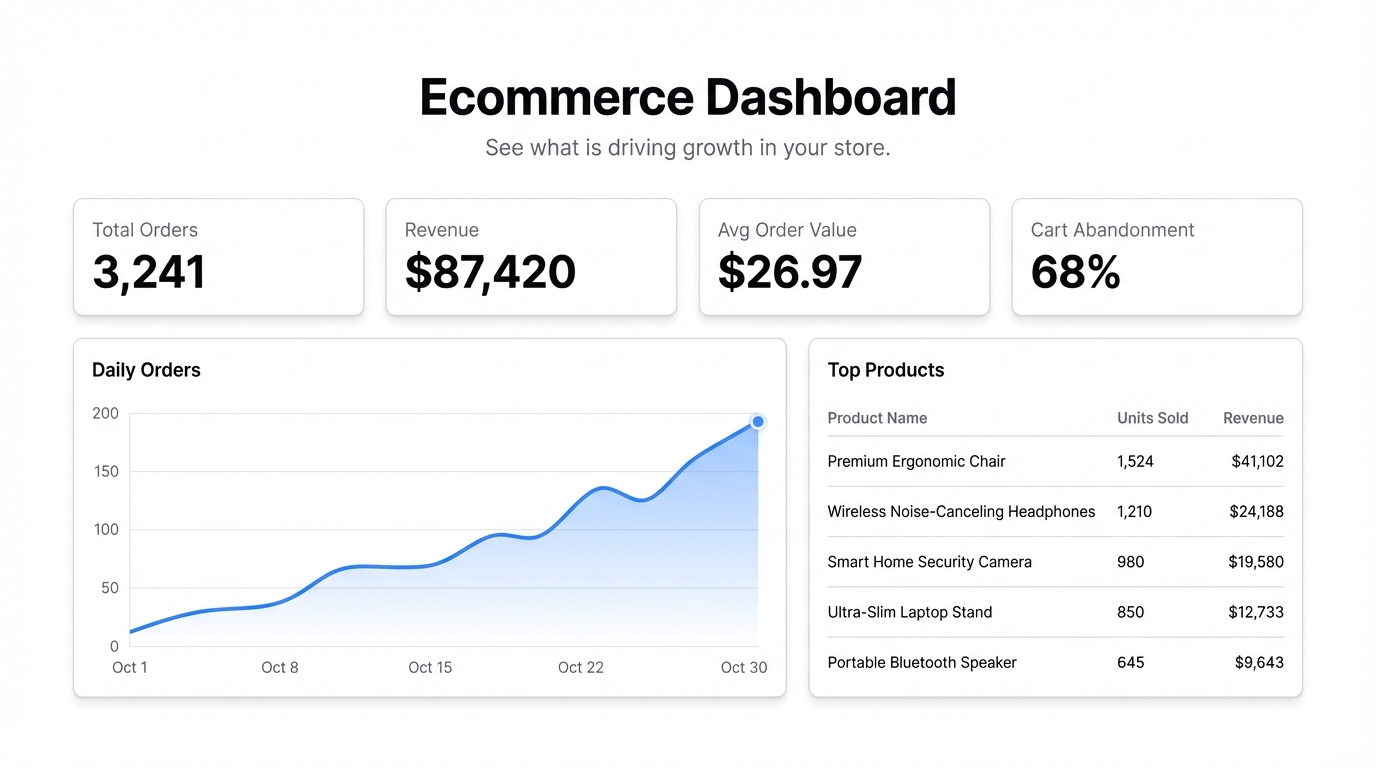
A simple dashboard structure
Row 1 — Revenue overview
- Total revenue (vs last period)
- Revenue by channel (bar chart)
- Daily revenue trend (line chart)
Row 2 — Conversion
- Overall conversion rate
- Conversion rate by traffic source
- Cart abandonment rate
Row 3 — Product performance
- Top 10 products by revenue
- Top 10 products by units sold
- Average order value trend
Row 4 — Customer metrics
- New vs returning customers
- Repeat purchase rate
- Customer acquisition cost
That’s four rows. One screen. The whole picture.
The share link that changes everything
If you’re running a team, the old workflow was: someone generates the report, exports a PDF, and emails it to everyone. By the time anyone reads it, it’s already slightly outdated. Questions come in, someone has to go back and recheck the data.
A shared dashboard link changes that. Share it once, and anyone can check the current numbers whenever they want. No emails, no PDFs, no “can you resend the report?”
For agencies managing multiple client accounts, you can create a password-protected link for each client. They see their data, you control what they see.
Start small, expand as you grow
You don’t need all of this on day one. If you’re just starting out, a dashboard with revenue by channel, conversion rate, and top products is already better than nothing.
As your business grows and your questions get more complex, add to it. The point is to have something you actually look at every week — not a dashboard you built once, haven’t updated in six months, and no longer trust.
Start building your ecommerce dashboard at Infograph — free plan, no credit card required. Upload your export and describe what you want to see.


