Most sales teams are drowning in data but starving for insight. CRM fields that never get filled in. Reports nobody reads. A Friday “pipeline review” that turns into a debate about which deals are actually real.
A good sales performance dashboard fixes that. It shows what’s happening across your pipeline — not what reps think is happening — and puts the right number in front of the right person at the right time.
What a Sales Performance Dashboard Tracks
Revenue Metrics
Start with the numbers leadership cares about:
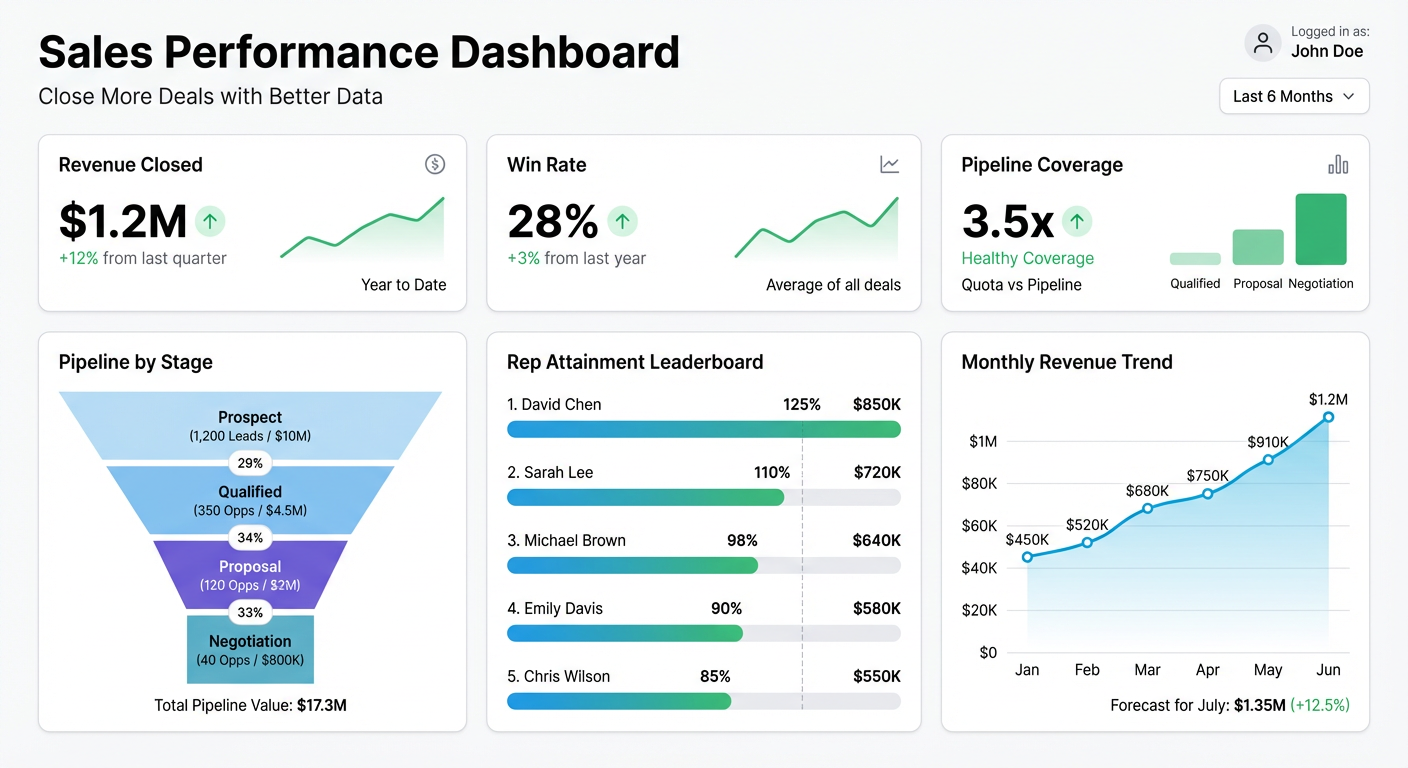
- Revenue closed this period vs target
- Attainment by rep — who’s ahead, who needs support
- Monthly recurring revenue (for SaaS teams) and net new ARR
- Average deal size — is it trending up or down?
- Win rate — of all qualified opportunities, how many closed?
The relationship between win rate and deal size matters. A team closing bigger deals at a lower win rate may be healthier than a team closing lots of small deals at a higher rate. Your dashboard should show both.
Pipeline Metrics
Revenue you’ve already closed is history. Pipeline is the leading indicator.
Track:
- Total pipeline value by stage
- Pipeline coverage — pipeline value vs revenue target (aim for 3-4x for most sales motions)
- Deals created this week/month — is top-of-funnel healthy?
- Deals past expected close date — stale pipeline is one of the most reliable signals that your forecast is wrong
- Stage conversion rates — where are deals getting stuck?
A waterfall chart showing deal movement through stages (created, progressed, won, lost) gives you a cleaner picture of pipeline velocity than a list of deal names ever will.
Rep Activity Metrics
Activity doesn’t always correlate with results, but sudden drops in activity almost always predict a revenue dip. Track:
- Calls and emails sent per rep
- Meetings booked and completed
- New opportunities created
- Days since last activity on open deals — this surfaces neglected pipeline fast
For frontline managers, rep activity is the daily heartbeat. For leadership, it’s context. If a rep is hitting their number but barely making any calls, either they have exceptional accounts or something unusual is happening.
Forecast Accuracy
Add a forecast tab showing committed deals vs actual closed. Over time this builds a pattern — how accurate is your forecast typically at 30, 60, 90 days out? That pattern is more valuable than any individual forecast.
Building Your Sales Performance Dashboard
Sales data usually lives in your CRM — Salesforce, HubSpot, Pipedrive, Zoho. Most of these tools have built-in reporting, but their dashboards are:
- Hard to customize without admin access
- Impossible to share outside the CRM
- Not great at combining multiple data sources
The workaround most teams use: export to a spreadsheet weekly and build reports manually. It works, but it means your dashboard is always at least a week stale.
Connect Live Data
If you export your CRM data to Google Sheets or Excel Online, Infograph can connect directly to that sheet and build a live sales dashboard.
Prompt: “Show revenue closed this month vs target, pipeline by stage as a funnel chart, top 10 deals by value, rep attainment as a ranked bar chart, and win rate trend over 6 months.”
The dashboard rebuilds every time your sheet updates. No manual exports. No stale data.
What Good Sales Dashboards Don’t Do
A sales performance dashboard is not a surveillance tool. Tracking every keystroke and call recording your team makes and displaying it on a public screen is a good way to destroy trust without improving performance.
The best dashboards surface what’s happening so managers can have better conversations — not replace conversations with public scorecards. Keep rep-level data visible to managers and the individual rep. Keep team-level data visible to everyone.
The Dashboard That Actually Changes Behavior
Sales teams respond to visibility. When reps can see their own attainment vs target and compare it to peers, performance improves without any management intervention. When pipeline coverage drops below 2.5x and it’s visible on the dashboard, the team starts creating new opportunities without being told.
The goal isn’t to monitor your team — it’s to make the right information obvious so good decisions happen naturally.
Build your sales performance dashboard and watch the team start managing itself. Start at app.infograph.ai.