Every data tool launched in the last two years has “AI-powered” somewhere in the marketing. Most of it means a chatbot was glued to an existing interface. Useful for generating SQL. Not the same as AI that actually builds visualisations for you.
Here’s what AI genuinely helps with in data visualisation — and where it doesn’t — plus which tools are worth your time based on what you’re actually trying to do.
Where AI Actually Helps
Writing queries. If you have a SQL database, AI can translate natural language questions into queries. “Show me revenue by country for Q3” becomes a syntactically correct SQL query. This is real and useful. It doesn’t eliminate the need for a data analyst, but it dramatically reduces the time they spend on routine queries.
Generating initial chart configurations. Given a dataset and a description, AI can produce a reasonable first chart — the right type, sensible axis labels, appropriate grouping. Not always perfect, but a good starting point that takes seconds instead of minutes.
Summarising trends. Point an AI at a chart or dataset and ask “what’s interesting here?” — it’ll surface the obvious trends, anomalies, and comparisons a human might miss on first look. Useful for large datasets where you don’t know what to look for.
Building dashboards from descriptions. This is the newest capability and the most genuinely transformative. Instead of configuring charts manually, you describe what you want and the AI builds it. A few tools do this well.
Where AI Doesn’t Help (Yet)
Replacing a data engineer on complex pipelines. If your data is spread across five systems, requires custom transformations, and has messy schemas, an AI dashboard tool won’t fix that. You still need someone who understands your data infrastructure.
Generating novel insights on complex data. AI summarises what’s visible in the data. It doesn’t make analytical leaps the way a skilled analyst does. It’s a speed tool, not an intelligence tool.
Highly custom visualisations. If you need a specific, unusual chart type with precise configuration, a prompt interface will frustrate you. Traditional BI tools give you that control.
By Use Case: What to Use
If you want to visualise spreadsheet data
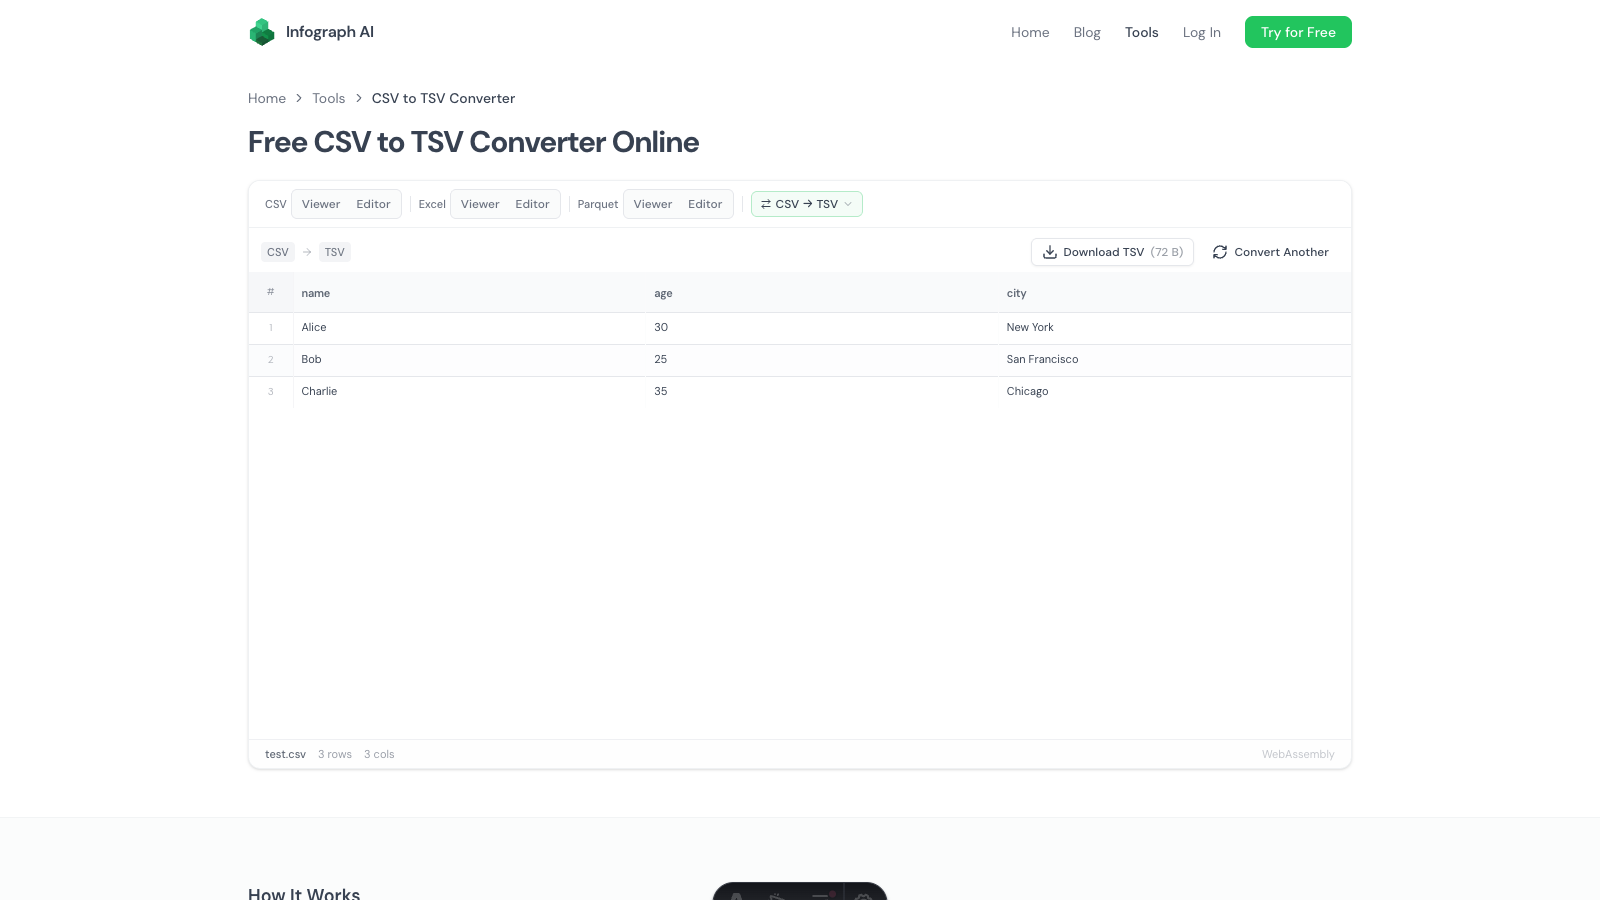
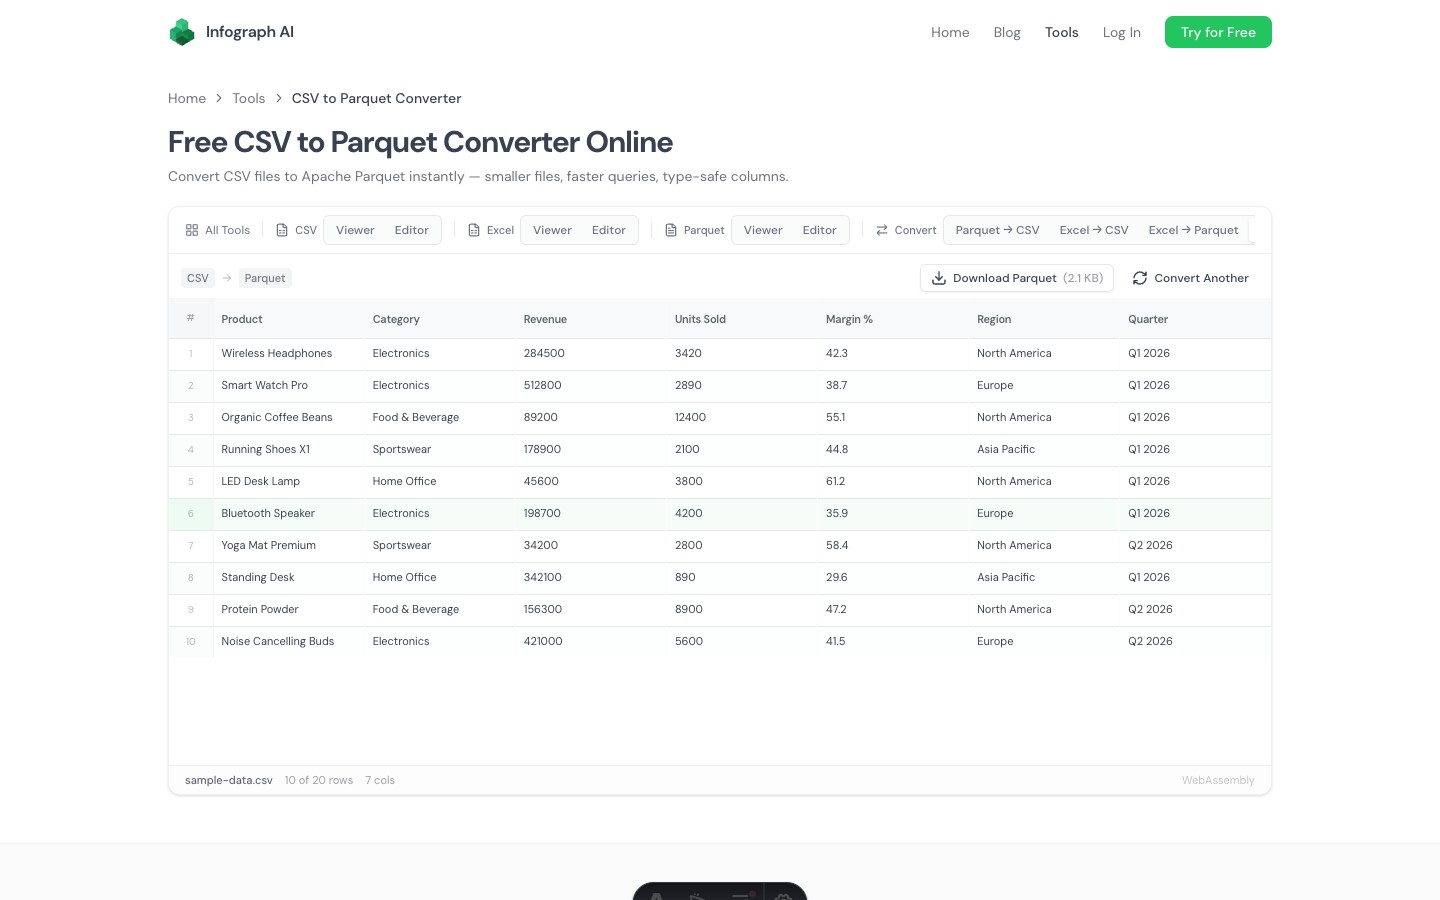
This is the clearest use case for AI dashboard tools. You have data in a Google Sheet or Excel file. You want to see it as charts. You don’t want to spend an afternoon in Excel’s chart builder.
Use Infograph. Upload your CSV or connect your Google Sheet or Excel Online file. Describe what you want. The dashboard builds from your description. For teams updating a sheet regularly, the live connection keeps the dashboard current automatically.
Read more: CSV to Dashboard · Excel Dashboard with AI · Google Sheets Live Dashboard
If you’re a data analyst or BI professional
You have SQL access, you know your data, and you want visualisation flexibility.
Use Tableau or Looker. Neither is truly AI-native (both added AI assistants to existing BI platforms), but both have the chart depth and customisation that professional BI work requires. If you’re already in the Google ecosystem, Looker Studio is free.
For SQL query assistance specifically, Julius AI or ChatGPT with Code Interpreter are faster than learning a new tool.
If you want to ask questions about a dataset conversationally
You have a CSV and you want to explore it — ask questions, get summaries, understand what’s in it.
Use Julius AI or ChatGPT. Both let you upload a file and ask questions in natural language. Julius specialises in data; ChatGPT is more general but capable. Neither produces a shareable dashboard, but for exploratory analysis they’re fast and capable.
If you’re a developer building data-heavy products
Use Recharts, Vega-Lite, or Observable Plot depending on your stack, with an LLM assisting on the chart configuration. Copilot-style AI assistance accelerates the work; you retain full control over the output.
If you need predictive analytics (not visualisation)
Use Obviously AI or DataRobot. Different problem — forecasting and classification rather than visualisation. Don’t confuse the two categories.
The Honest State of AI Visualisation in 2026
The gap between “AI-assisted” and “AI-native” is still wide. Most tools in this space are traditional BI platforms with an AI query layer on top. Useful, but not transformative.
The genuinely new thing — describing a dashboard in plain English and having it built — is real and works, but the tools doing it well are still a small subset of the market. They’re best suited to the most common dashboard use case: non-technical users with data in spreadsheets who want a view on that data without learning a BI tool.
For that use case, the AI approach is dramatically faster than any traditional alternative. For complex analytics work, traditional tools still have the edge.
The right question isn’t “which AI tool is best?” It’s “what are you actually trying to do with your data?” The answer determines which category of tool you need, and from there the choice is clearer.
Getting Started
If you’re in the spreadsheet-to-dashboard category — which is most teams — the free tier is a genuine test:
Try Infograph free with your own data — no credit card →
If you have a more complex setup, the tools linked above are worth evaluating for your specific case. But start with the simplest thing that could work. For most people, that’s simpler than they expect.