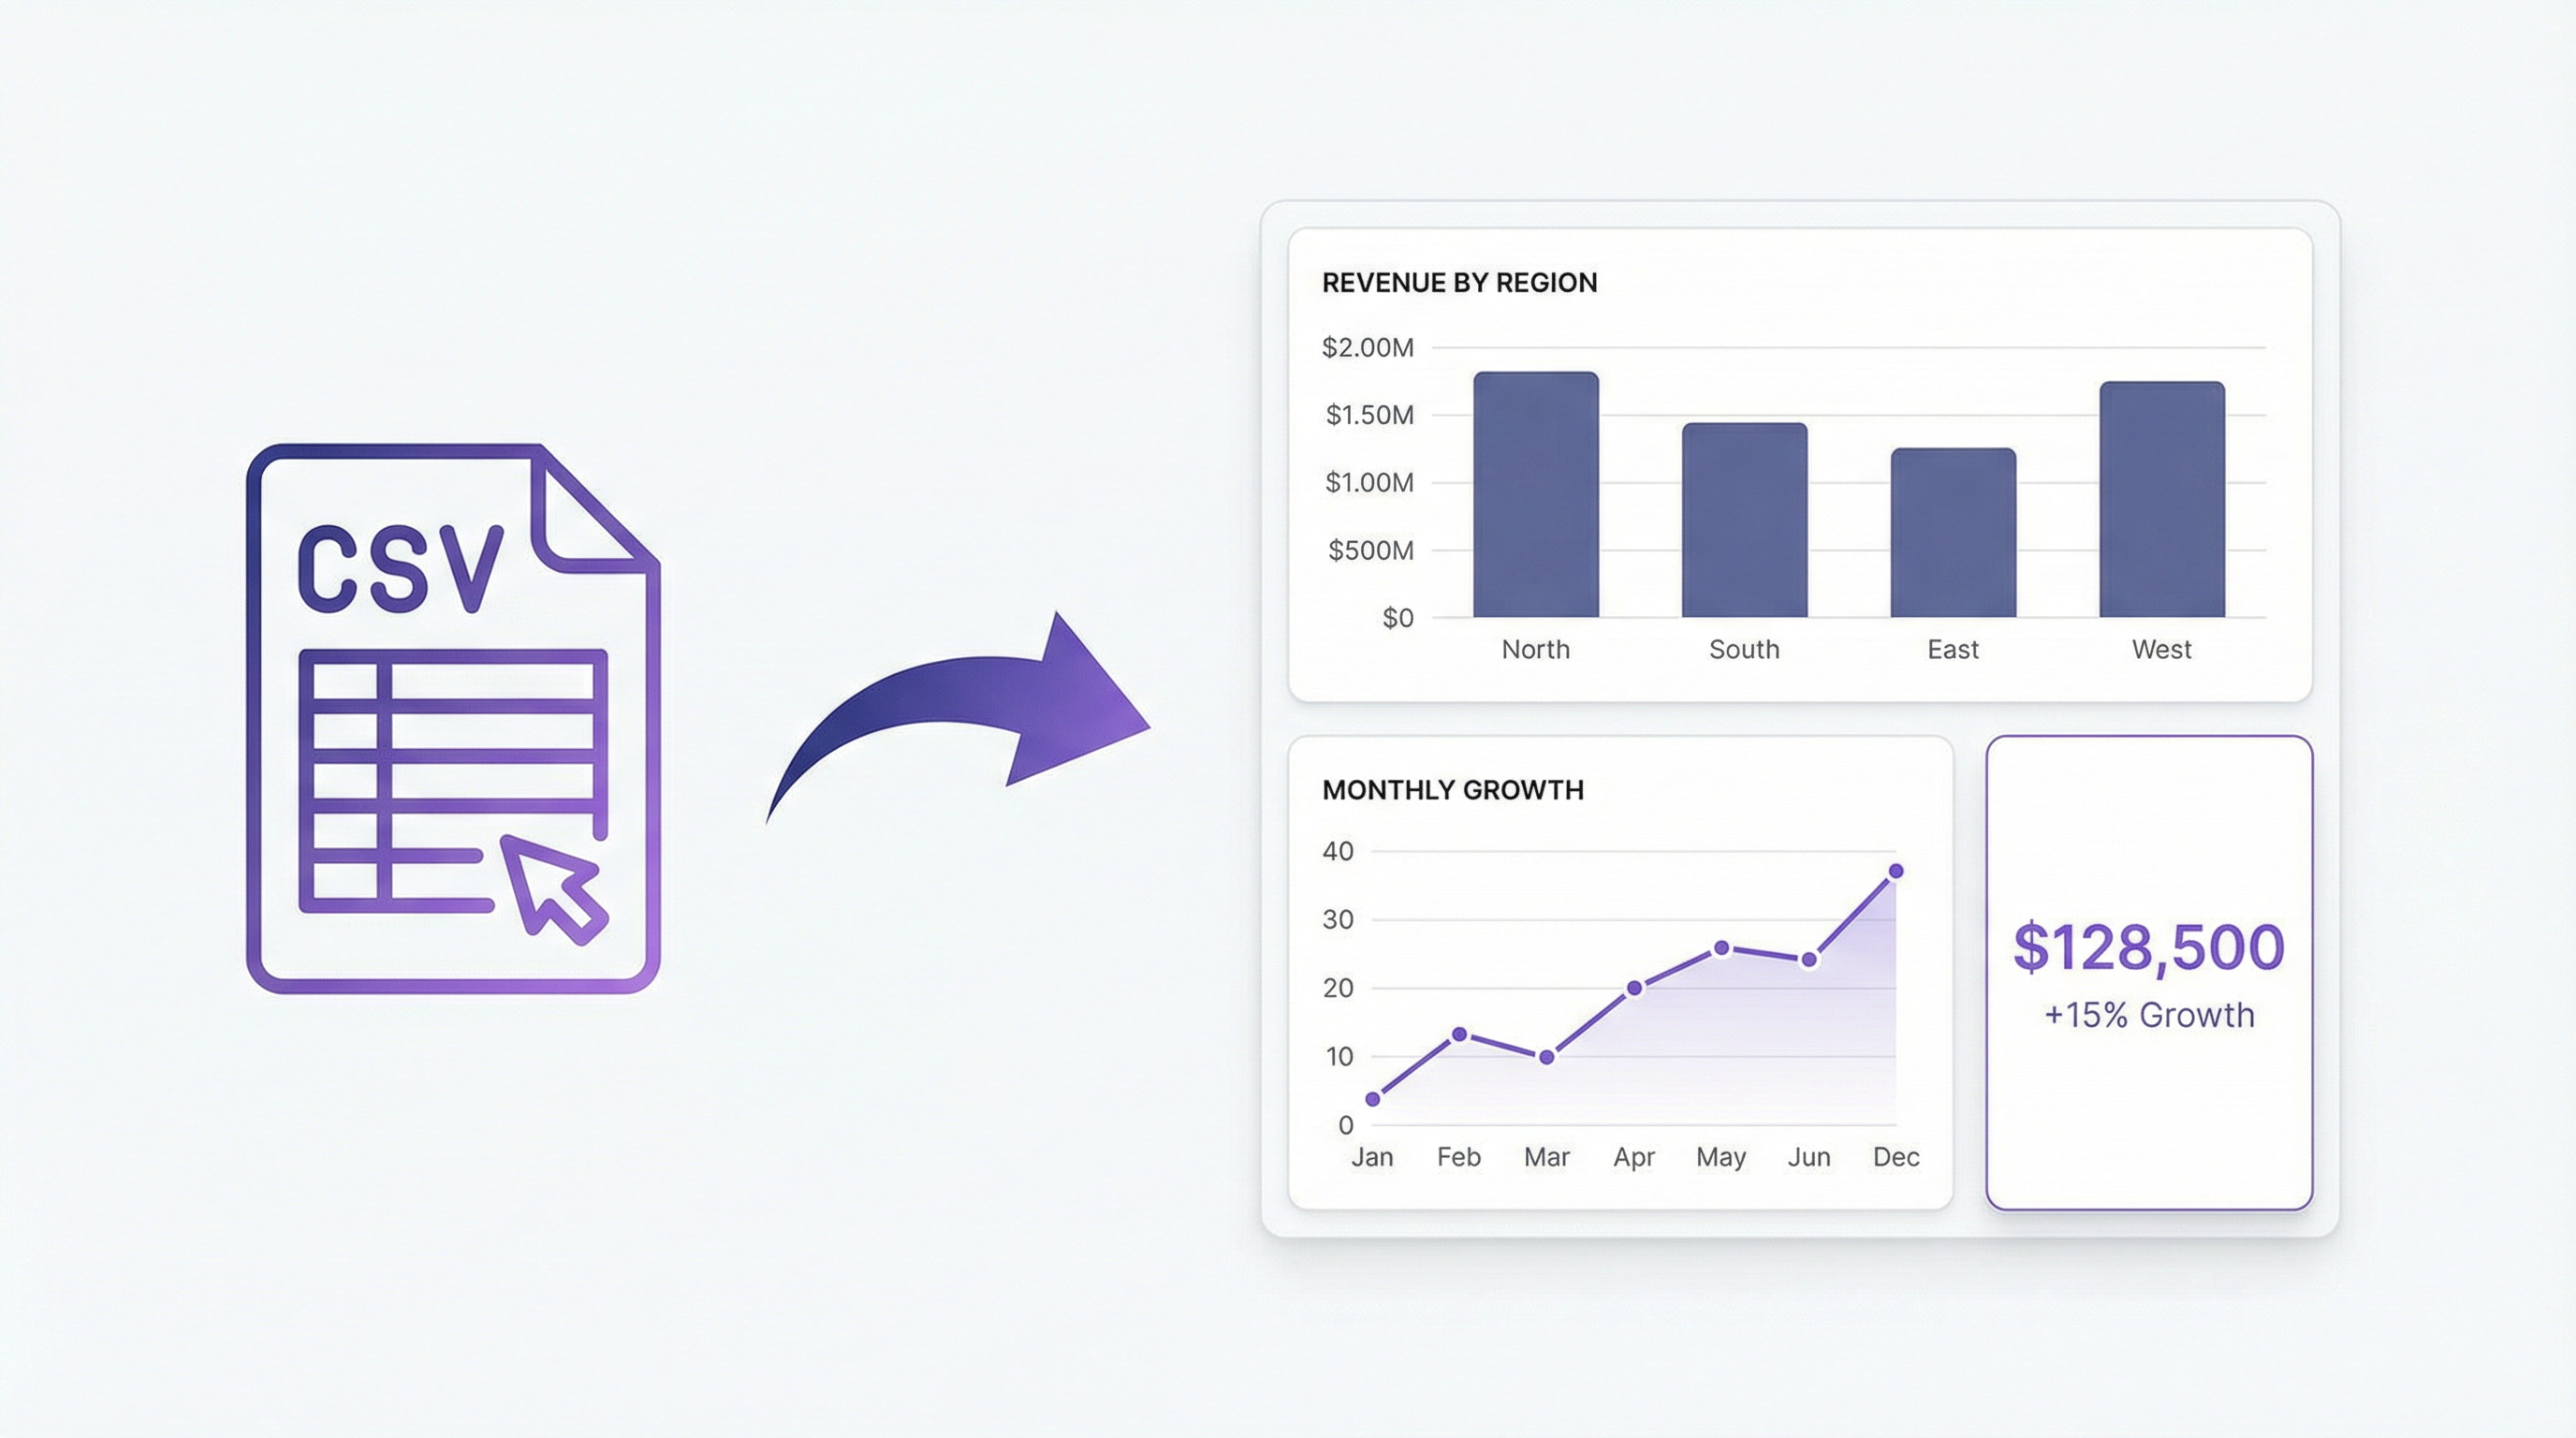
You have a CSV file. You want a chart — or a full dashboard. What you don’t want is to open Excel, wrestle with pivot tables, or write a Python script just to see a bar chart.
Here’s the thing: that gap between “I have data” and “I can see what it means” is exactly what Infograph closes. Upload a CSV, type what you want, get a dashboard. The whole thing takes less than two minutes.
Why CSV Is the Universal Starting Point
CSV files are everywhere. Every CRM exports them. Every analytics platform exports them. Stripe, Shopify, Google Analytics, Airtable, your bank — they all have a “Download CSV” button somewhere.
The problem is that a CSV is just rows and columns. It doesn’t tell you anything by itself. You need a layer on top that transforms raw numbers into something you can actually read.
That’s a dashboard.
The Infograph Workflow (No Technical Skills Required)
Here’s a real example. Say you have a sales export from your CRM: columns for date, rep name, deal value, region, and stage. Classic CSV. About 400 rows.
Step 1: Upload the file.
Go to app.infograph.ai, create a free account (no credit card), and click “New Dashboard”. Drag your CSV in. Takes about five seconds.
Step 2: Describe your dashboard.
This is the part that surprises people. Instead of selecting chart types and dragging fields, you just type:
“Show total revenue by rep as a bar chart. Add a line chart for monthly deals closed. Include a summary card for total pipeline value.”
Infograph reads the columns in your CSV, maps them to what you described, and builds the dashboard. It knows that “rep name” is the grouping variable for “total revenue by rep” — you don’t have to configure anything.
Step 3: Watch it build.
Within seconds, you have a working dashboard. Three charts, live data, the exact view you described.
That moment — when you type a sentence and a dashboard appears — is the “I can’t believe that just worked” feeling we’re going for. It sounds like it shouldn’t work. It does.
Step 4: Iterate.
Keep prompting. “Break the revenue chart down by region instead.” “Add a win rate card.” “Change the monthly chart to weekly.” Every prompt refines the dashboard in real time. You’re having a conversation with your data, not fighting a configuration panel.
Step 5: Share it.
Hit Publish. You get a shareable link. Send it to your team, embed it in Notion, show it in a client meeting. The dashboard lives at that URL, pulling from the data you uploaded.
What Kinds of CSV Files Work?
Short answer: anything with columns and rows. Some specific examples:
- Sales data — revenue by rep, pipeline by stage, deals by month
- Marketing analytics — impressions, clicks, conversions, cost by campaign
- Fitness or health tracking — exported from Apple Health, Garmin, Oura
- Financial data — expenses by category, monthly P&L, budget vs actuals
- Product metrics — signups by source, feature usage, retention by cohort
- Operations data — support tickets by status, fulfilment rates, SLA tracking
If your data is structured (consistent columns, one row per record), Infograph can build a dashboard from it. Messy headers, mixed date formats, blank rows — it handles these without you having to clean the file first.
The Free Tier: Actually Free
“Free” on most dashboard tools means “free for 14 days, then we ask for a card.” Infograph’s free plan is different.
One dashboard. 500 AI credits (worth roughly $0.50 of AI usage — enough to build a complete dashboard and iterate on it). Full sharing via public link. No credit card field anywhere in the signup flow.
You can go from zero to a published, shareable dashboard without paying anything. If you want more — five dashboards, live data connections to Google Sheets or Excel Online, access controls — that’s the Pro plan at $19.99/month.
But try the free tier first. Most people are surprised by how far it gets them.
Why This Beats the Alternatives
Building charts in Excel is fine if you enjoy pivot tables. Most people don’t. It also doesn’t produce a shareable link — you’re emailing files back and forth.
Python (pandas, matplotlib, plotly) is powerful if you write code. Most people don’t want to write code just to see their data.
Google Looker Studio connects to Google Sheets natively but has a drag-and-drop interface that still requires you to manually configure every chart. Fast compared to Excel, slow compared to Infograph.
Infograph’s advantage is the prompt interface. You describe what you want, and it builds it. No chart type selection, no field mapping, no configuration. The trade-off is that for very complex or custom visualisations, a proper BI tool gives you more control. For 90% of dashboards that teams actually need, the prompt approach is faster and produces better results.
Try It Now
You don’t need a tutorial, a setup call, or a technical background. You need a CSV file and two minutes.


