Your spreadsheet has all the data. But every time you need to share insights, you’re exporting, screenshotting, or rebuilding charts in PowerPoint.
There’s a better way.
The Problem with Spreadsheets as Reports
Spreadsheets are incredible for storing and manipulating data. But they weren’t designed for communication. When you share a spreadsheet:
- Colleagues see rows and columns, not insights
- Data goes stale the moment you hit “send”
- Formatting breaks across different devices
- Non-technical stakeholders struggle to interpret the numbers
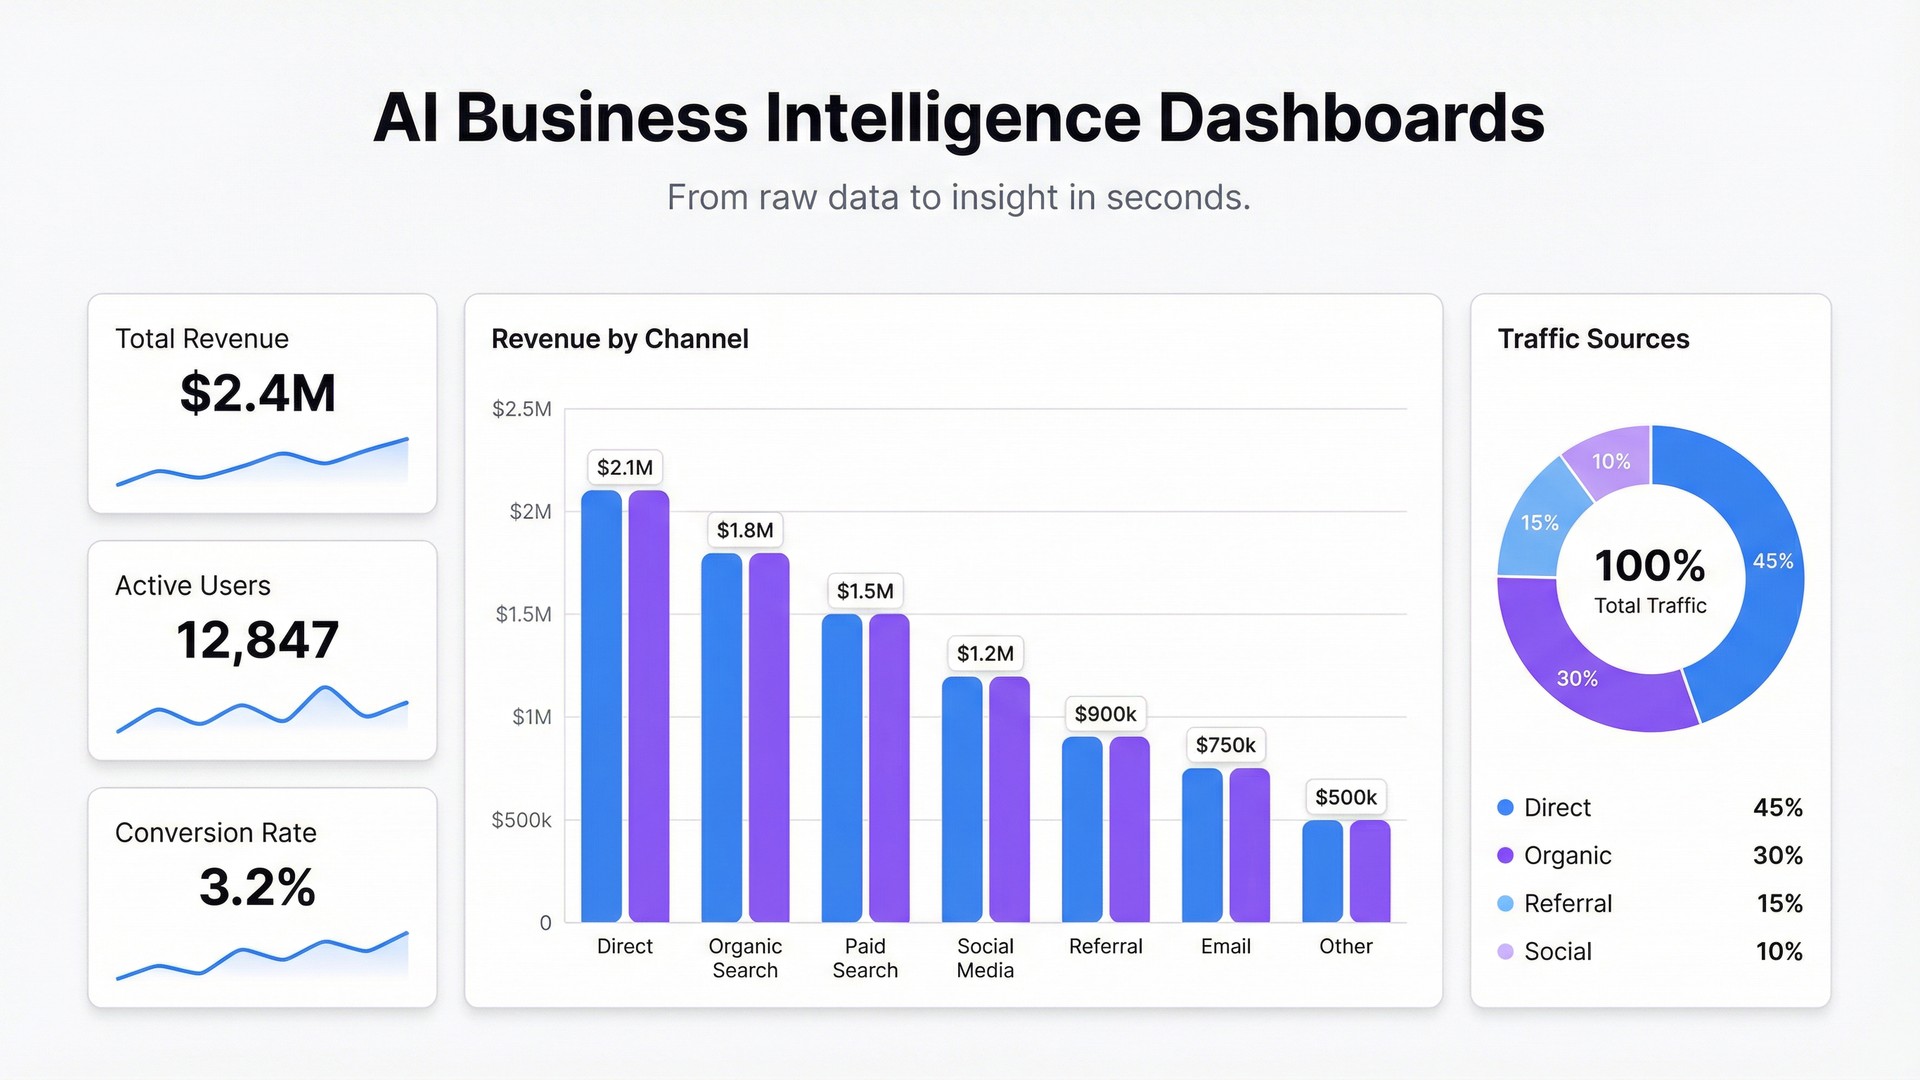
Enter Live Dashboards
A dashboard transforms raw data into visual stories. But traditional dashboard tools come with steep learning curves, manual data syncing, and hours of configuration.
With AI-powered tools like Infograph, you can skip the complexity:
- Connect your spreadsheet — Link Google Sheets or Excel directly
- Describe what you want — “Show me monthly revenue trends with a breakdown by region”
- Watch it build — AI generates the dashboard in seconds
Why “Live” Matters
Static reports are snapshots. Live dashboards are windows.
When your spreadsheet updates, your dashboard updates. No re-exports. No manual refreshes. Your team always sees the current state of the data.
Getting Started
Ready to transform your first spreadsheet? The process is simpler than you think. Connect your data source, describe the insights you need, and let AI handle the visualization.
Your data deserves better than rows and columns.