Google Sheets can absolutely hold a dashboard. It takes some work — pivot tables, chart configuration, named ranges, careful layout — but it’s doable. This guide walks through how to create a dashboard in Google Sheets from scratch, and then shows you what the same process looks like when AI handles the heavy lifting.
What You Need Before You Start
Your data needs to be clean and structured. One row per record, no merged cells, consistent date formats. If your data lives across multiple tabs, you’ll need IMPORTRANGE or QUERY to pull it together before building anything.
Decide what you’re measuring. A dashboard without a clear purpose turns into a wall of charts. Pick three to five key metrics before you touch a chart.
Step 1: Set Up Your Data Sheet
Keep your raw data on a separate tab — never build charts directly on top of it. Label this tab Data and leave it alone once you start building.
If your data updates regularly (weekly sales figures, monthly expenses), structure it so new rows just append to the bottom. That way your charts stay connected without manual rebuilding.
Step 2: Build Summary Calculations
Add a new tab called Summary. Use SUMIF, COUNTIF, AVERAGEIF, and QUERY to pull the numbers you want to display. For example:
=SUMIF(Data!B:B, "Q1 2026", Data!D:D)These summary cells become the data source for your charts and scorecards. Keep them clearly labelled — you’ll reference them repeatedly.
For time-series data, a pivot table works well. Go to Insert → Pivot table, point it at your Data sheet, and group by date.
Step 3: Create the Dashboard Tab
Add a new tab called Dashboard. This is the only tab your audience will see.
Set the background color to something neutral. White or light grey works. Remove gridlines (View → Show → Gridlines). This immediately makes it look less like a spreadsheet.
Step 4: Add Charts
Select a range from your Summary tab, then go to Insert → Chart. Google Sheets will make a guess at the chart type — usually adjust it to what you actually need.
For dashboards, stick to:
- Line charts for trends over time
- Bar charts for comparisons across categories
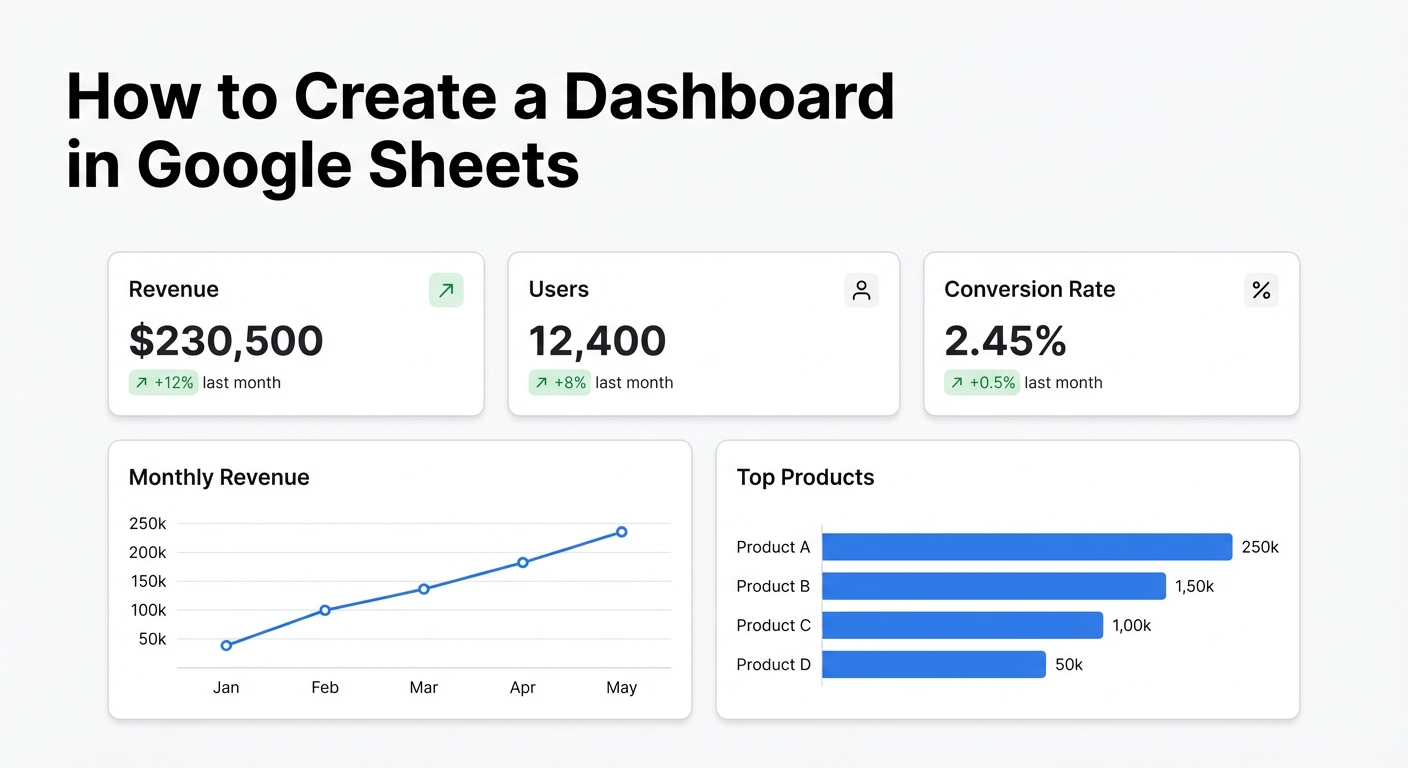
- Scorecard charts for single key numbers (revenue, conversion rate)
- Pie charts sparingly — only when parts-of-a-whole is the actual story
After inserting each chart, move it to your Dashboard tab by clicking the three-dot menu on the chart and selecting Move to own sheet — then cut and paste it back, or use the chart editor to place it where you want.
Resize charts by dragging their corners. Align them using the gridlines as guides.
Step 5: Add Scorecards for Key Metrics
Scorecard charts are Google Sheets’ best feature for dashboards. They show a single number with an optional comparison to a baseline.
Insert → Chart → Chart type → Scorecard chart
Point the value at a summary cell. Add a comparison value (last month, same period last year) and Sheets will automatically show the change with a colour-coded arrow. This is the fastest way to surface the headline number in any metric.
Step 6: Lock Down the Layout
Once you’re happy with the layout:
- Protect the Dashboard tab (Data → Protect sheets and ranges) so collaborators can’t accidentally move charts
- Hide the Data and Summary tabs from viewers who don’t need them
- Share the file with view-only access for anyone who just needs to read it
The Limits of Google Sheets Dashboards
You can build something solid in Sheets. But there are real constraints:
Manual data updates. Unless you’re using a live Google Sheets connection to an external data source, someone has to keep the data fresh. A dashboard that’s two weeks stale isn’t a dashboard — it’s a historical document.
Chart customisation. Sheets’ chart editor is functional but limited. You can’t easily build multi-axis charts, custom tooltips, or dynamic filters the way you’d want for a proper executive dashboard.
Scale. If your dataset gets large, Sheets slows down. QUERY formulas across 50,000 rows will test your patience.
Sharing. Sharing a Sheets dashboard means sharing your entire spreadsheet. You can restrict tabs, but it’s clunky compared to a purpose-built sharing link.
A Faster Way to Build Dashboards from Google Sheets
If your data already lives in Google Sheets, Infograph connects directly to your sheet and builds the dashboard from a plain-language prompt.
Connect your Google account, select the sheet, type what you want — “show monthly revenue trend, top 5 products by sales, and conversion rate vs last month” — and the dashboard appears. It stays live: when your sheet updates, the dashboard updates.
No pivot tables. No chart formatting. No tab management. The whole process takes two minutes instead of two hours.
You still learn something from building a Sheets dashboard manually — it forces you to think about what data you have and what story it tells. But for ongoing dashboards that need to stay fresh and look professional, connecting directly to the source beats manual builds every time.
Try this with your own data at app.infograph.ai.


