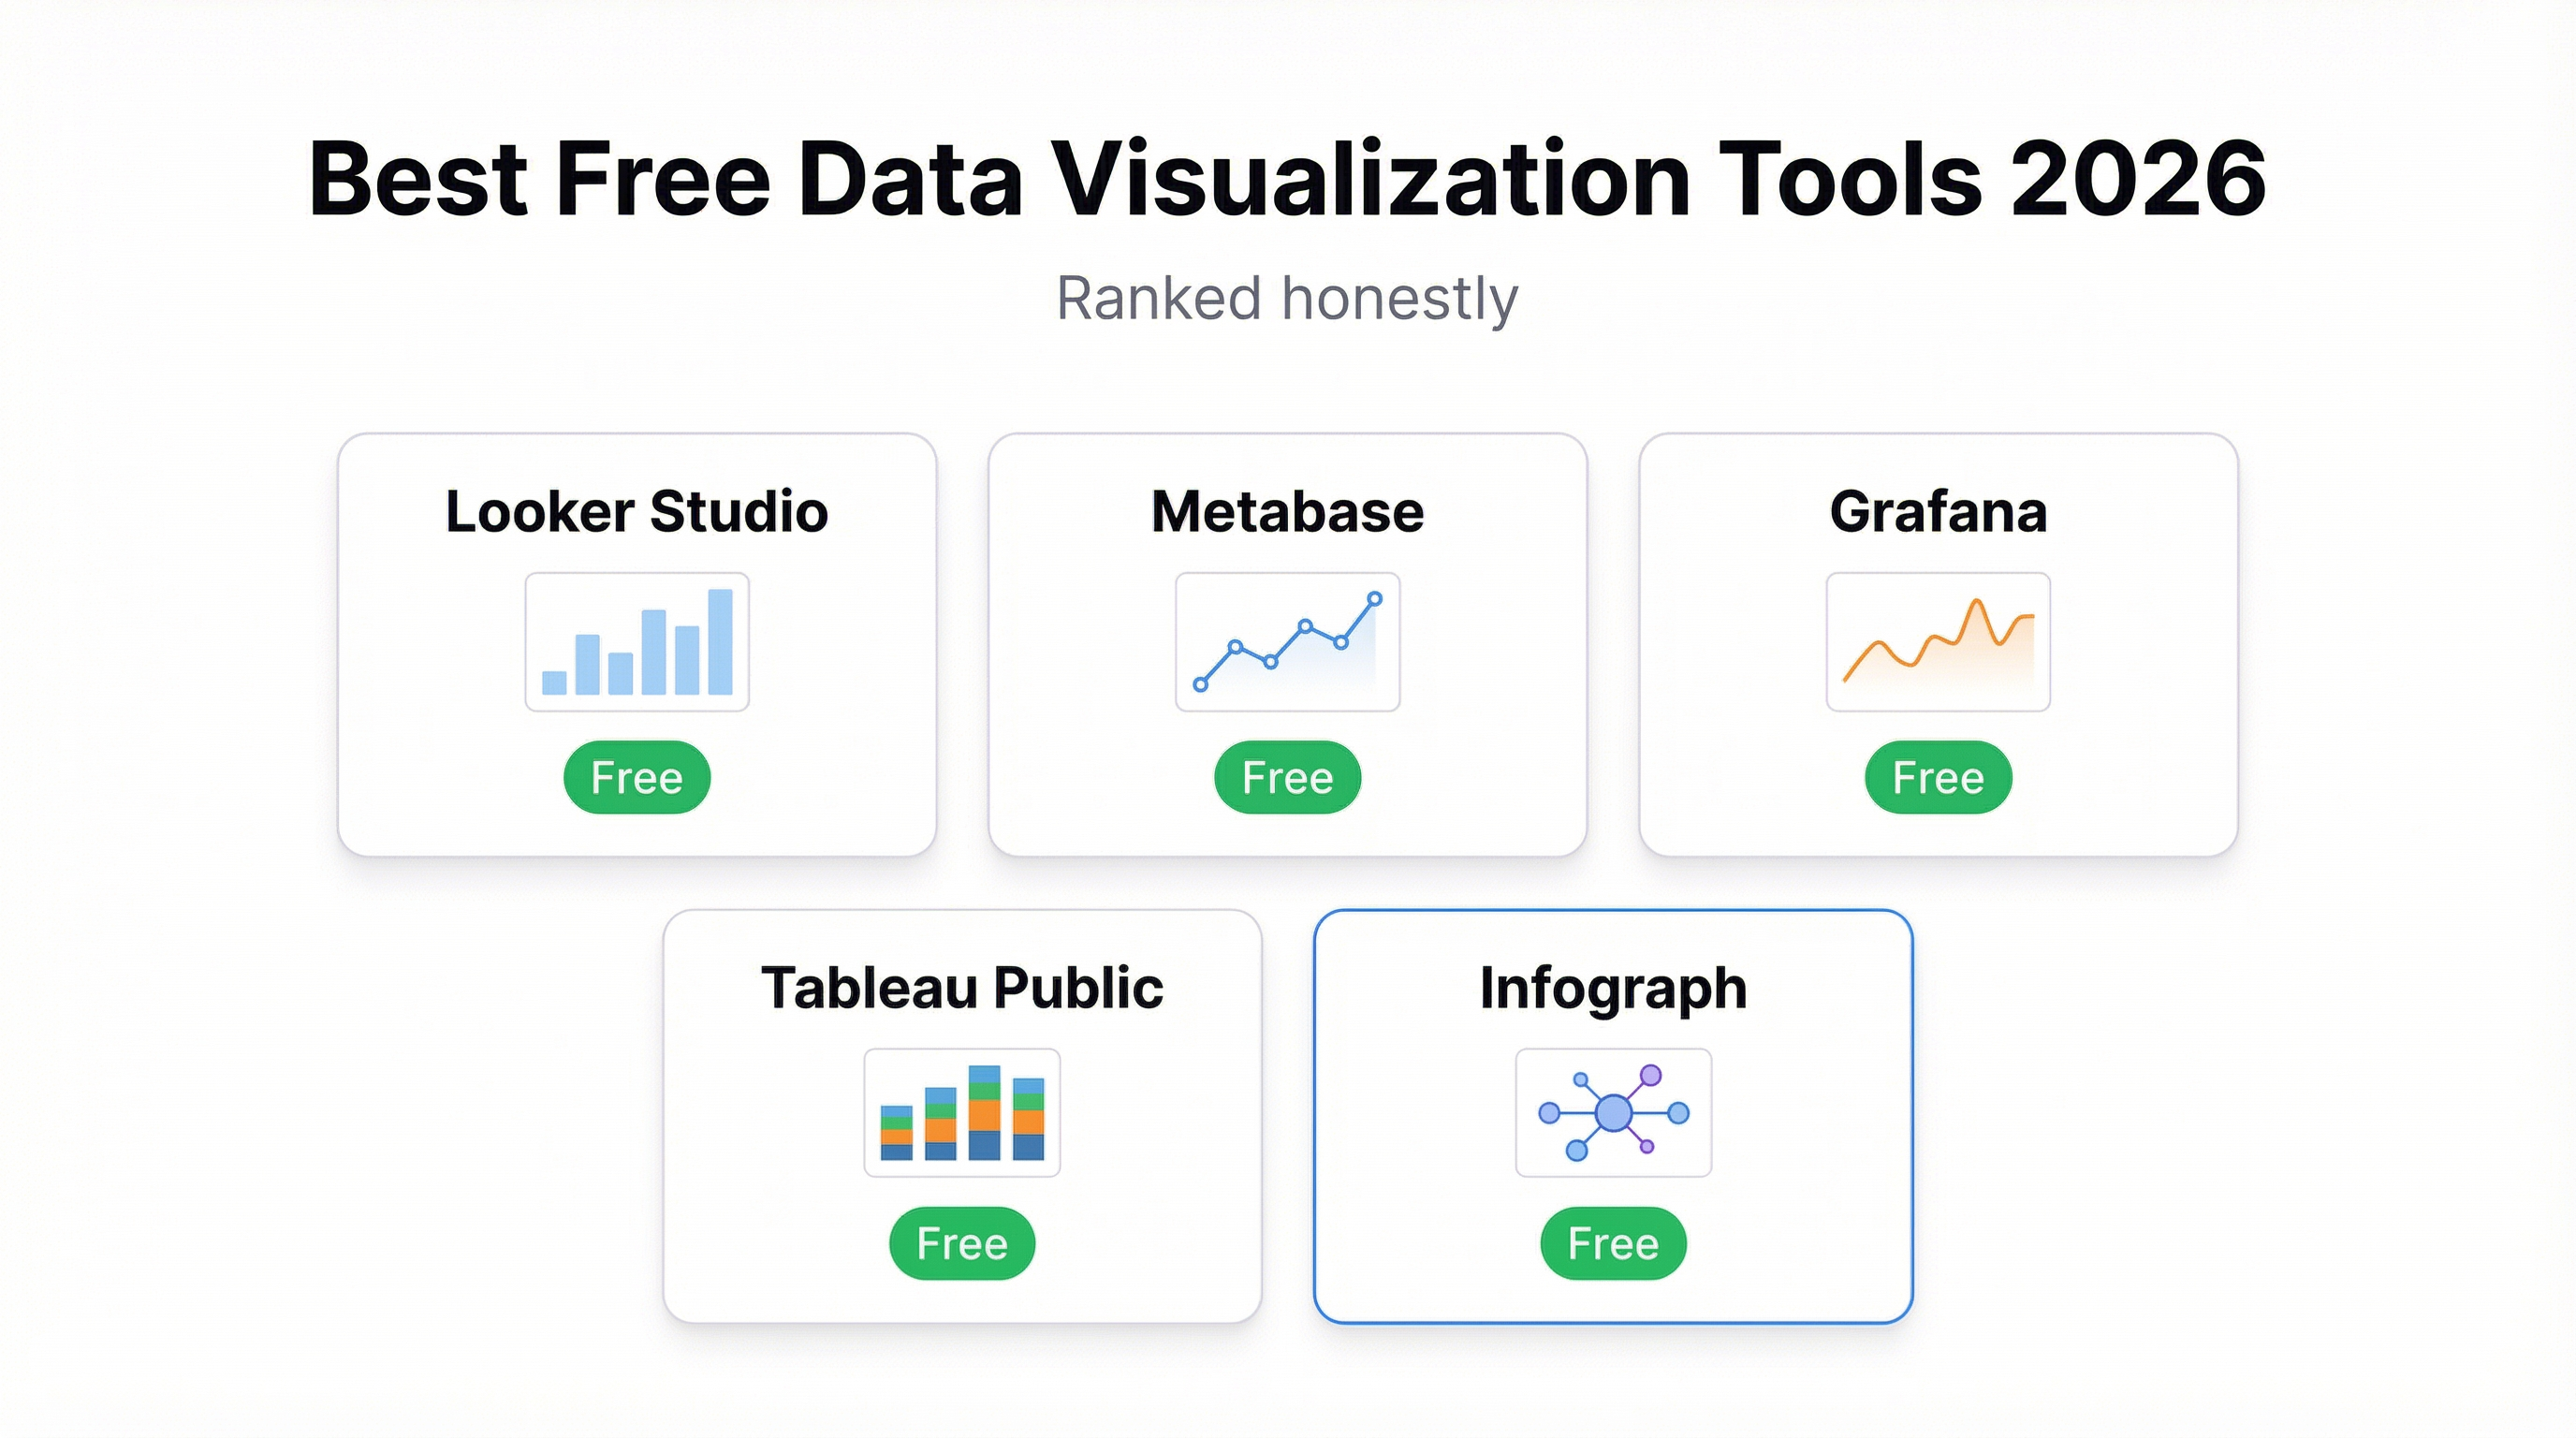
Free data visualization tools have gotten genuinely good. The catch is that “free” means different things to different products — free with a steep learning curve, free if you already live in one ecosystem, free if you don’t mind your data being public, or actually free. This post breaks down which tools are worth your time and who they’re actually built for.
No hedging. Here’s the honest ranking.
1. Metabase — Best for SQL Users Who Want Self-Serve
Metabase is open source and genuinely free to self-host. If your team has a developer who can spin up a Docker container, you can have a fully-featured BI tool running on your own infrastructure at zero cost. The hosted version (Metabase Cloud) starts at $500/month, but the self-hosted option is real.
What it does well: Metabase shines for teams with a database backend. Its question builder lets non-technical users filter and segment data without writing SQL — but when they need to, the native SQL editor is there. Dashboards are clean, the sharing model is straightforward, and the filtering system is genuinely good.
Where it falls short: “Free” here means you’re paying in ops time. Someone needs to install it, maintain it, and keep the server running. For a startup without DevOps bandwidth, that friction adds up fast. Also, Metabase’s visual customization is limited — you get the charts Metabase gives you, styled the way Metabase styles them.
Who it’s for: Engineering-adjacent teams who want to give non-technical stakeholders self-serve analytics without paying enterprise BI pricing.
2. Google Looker Studio — Best for Google Ecosystem Users
Looker Studio (formerly Data Studio) is completely free and connects natively to Google Analytics, Google Ads, BigQuery, Google Sheets, and about 800 community connectors. If your data already lives in Google’s infrastructure, this is hard to beat on price.
What it does well: The connector library is enormous. Looker Studio can pull from almost anything, and for Google-native data sources the connection is instant. Sharing works exactly like Google Docs — link sharing, view-only, edit permissions. For teams already using Google Workspace, the learning curve for sharing and collaboration is nearly zero.
Where it falls short: The interface is dated. Building a dashboard in Looker Studio feels like fighting a PDF editor — everything is positioned absolutely, alignment is manual, and there’s no responsive layout. It’s also slow: reports can take 10-30 seconds to load depending on data source size. And while the connector library is massive, anything outside the Google ecosystem requires paid third-party connectors or a BigQuery intermediary.
The lock-in is real. If you build your reporting infrastructure in Looker Studio and later move off Google Analytics or BigQuery, you’re rebuilding from scratch.
Who it’s for: Marketing teams running entirely on Google stack who need a free, shareable report without IT involvement.
3. Grafana — Best for Time-Series and Infrastructure Monitoring
Grafana is exceptional. For its intended use case — monitoring infrastructure, application performance, and time-series data — it’s arguably the best tool available at any price. The open source version is free to self-host and the cloud free tier gives you 10,000 active series and 50GB of logs.
What it does well: Grafana’s panel library for time-series visualization is unmatched. You can connect to Prometheus, InfluxDB, Loki, Elasticsearch, Datadog, and dozens of other data sources. Alert rules, annotations, and real-time streaming are all first-class features. The template variable system lets you build genuinely dynamic dashboards that update based on dropdown selections.
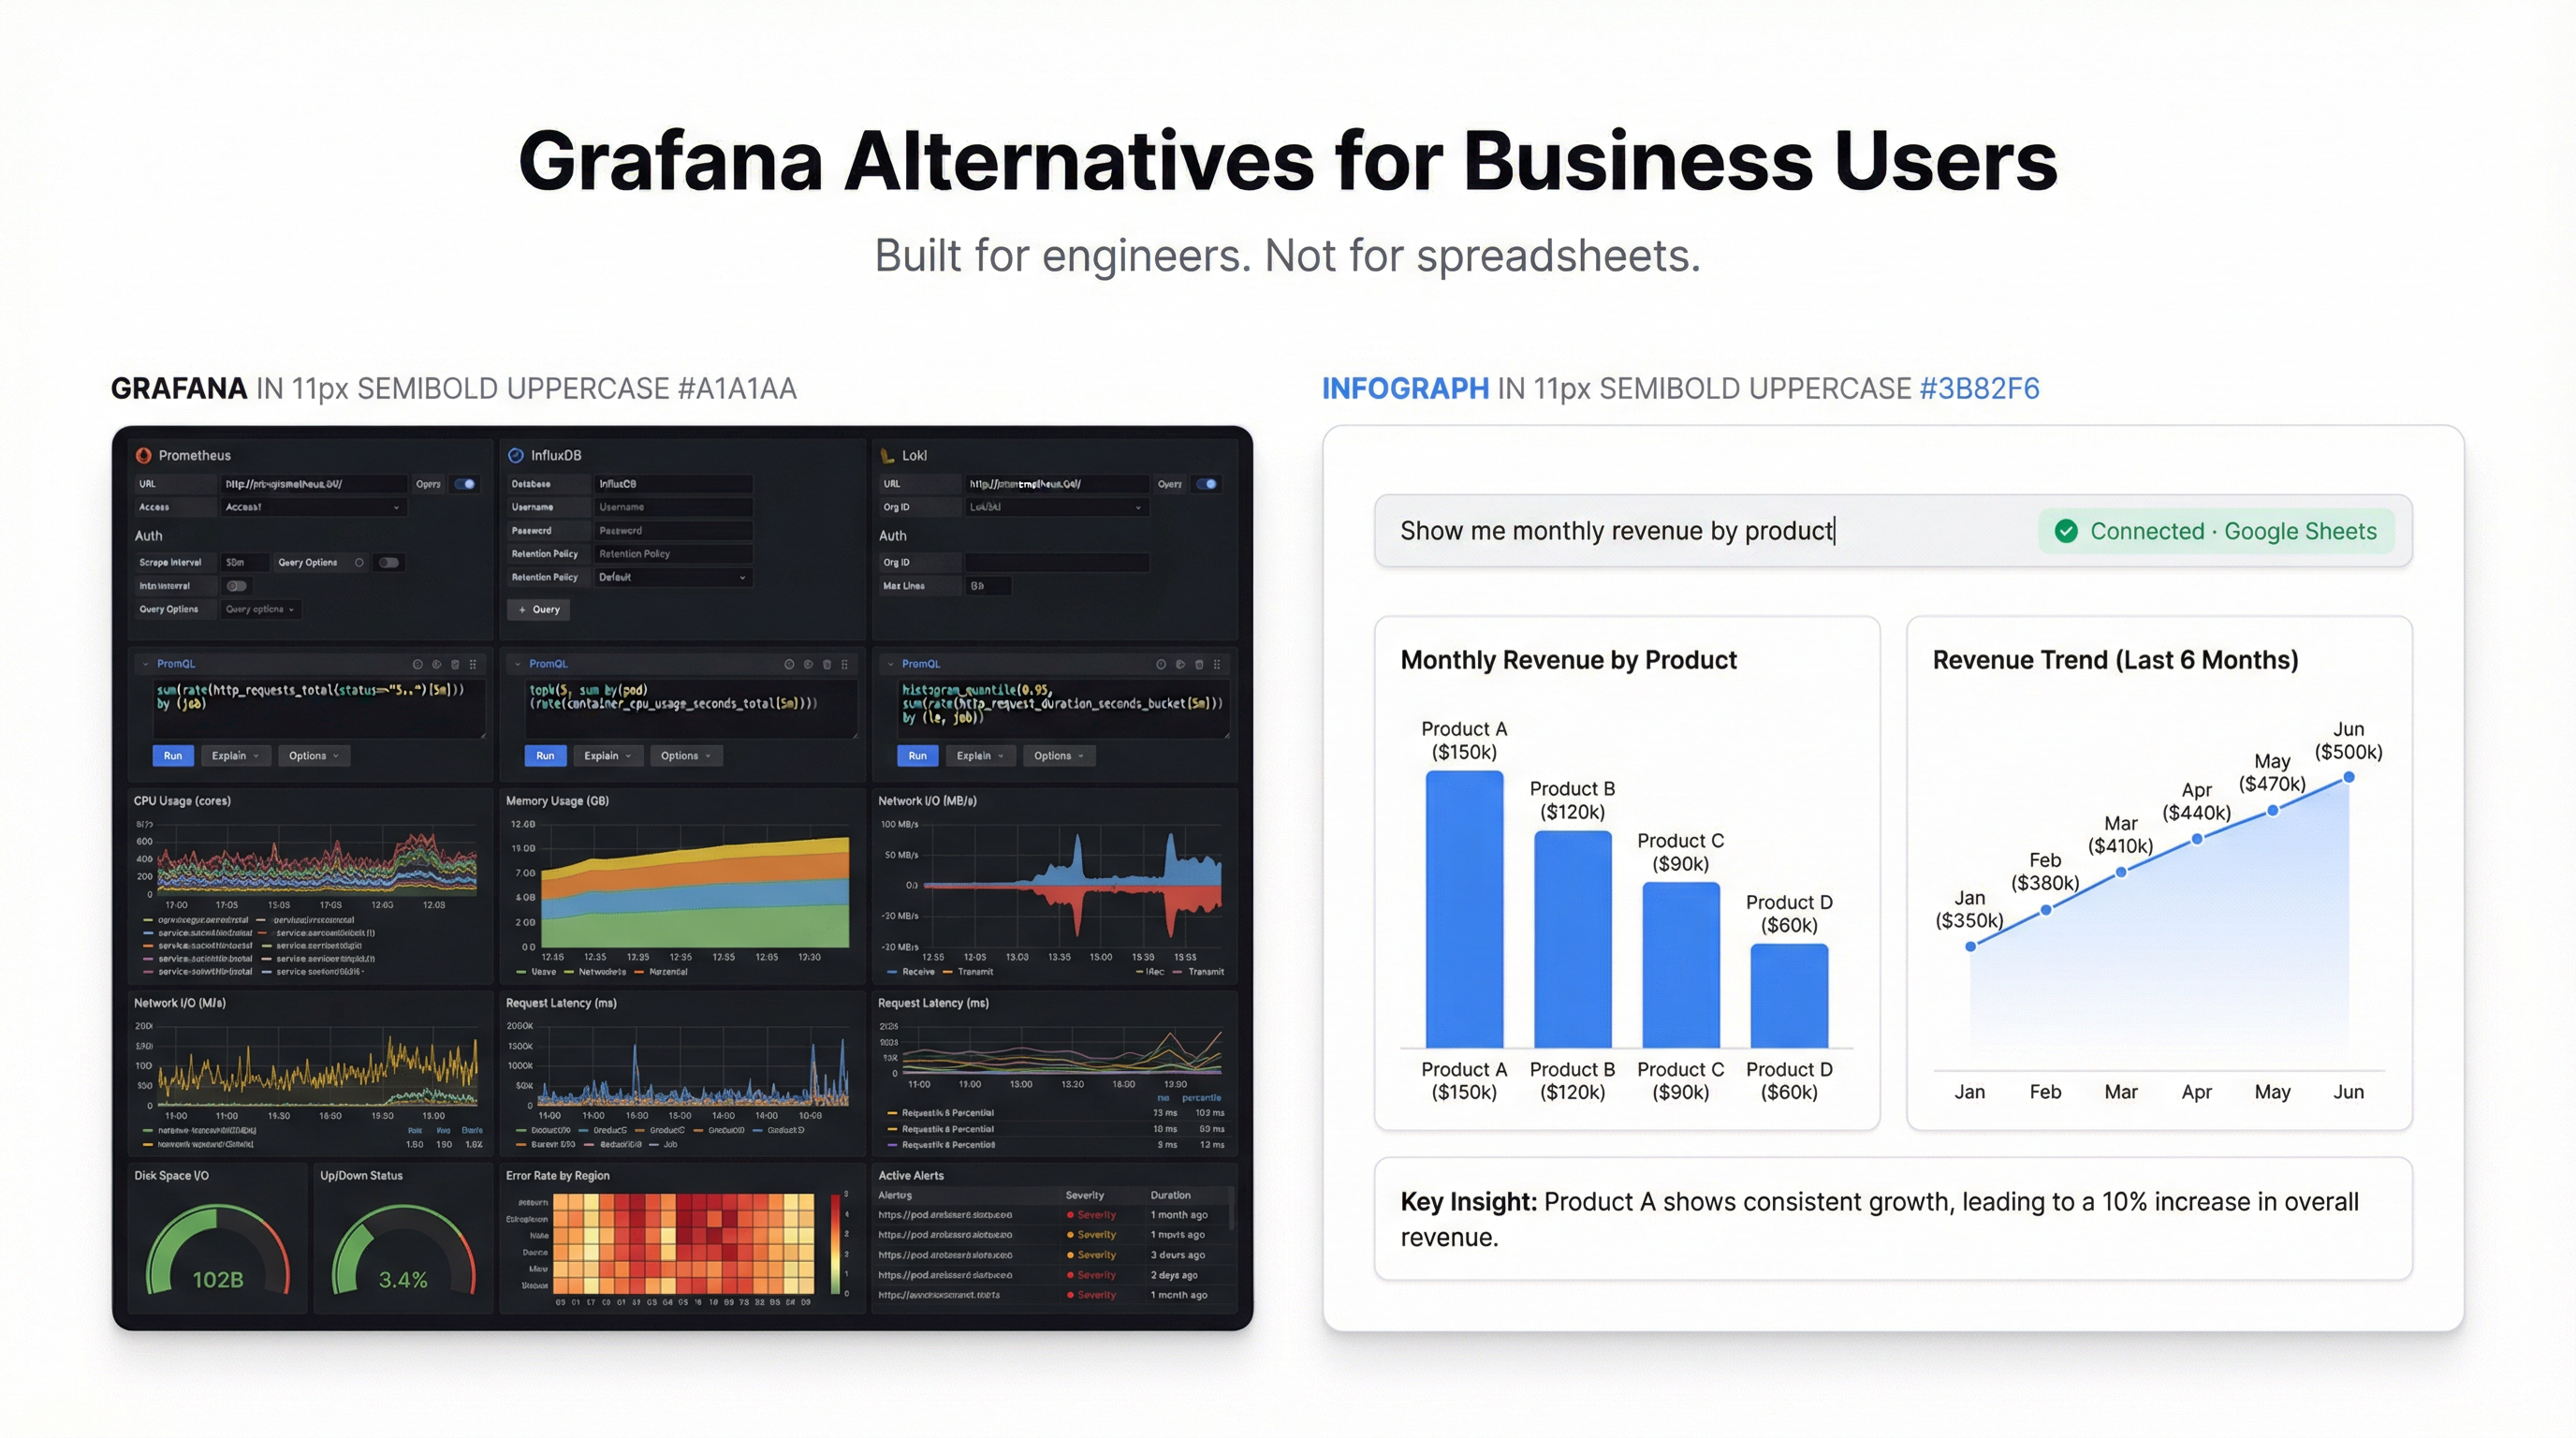
Where it falls short: Grafana is built for engineers watching servers, not analysts watching revenue. Business dashboards — think monthly sales by region, customer cohort retention, marketing funnel — are technically possible but awkward. The data model assumes time-series; relational data doesn’t map cleanly. If your users are trying to understand business metrics rather than system metrics, Grafana will frustrate them.
Who it’s for: DevOps and SRE teams monitoring infrastructure. Wrong tool for business analytics.
4. Tableau Public — Free, But Your Data Is Public
Tableau Public is Tableau’s free tier, and the core product is excellent. The visualization quality, the drag-and-drop interface, and the calculated field system are all genuinely world-class. Tableau built the category and still sets the standard for desktop BI.
What it does well: Tableau’s visualization engine is the best in class. You can build sophisticated charts that other tools simply can’t produce. The community is enormous — if you want to learn data visualization as a discipline, Tableau Public’s gallery is the best learning resource available. Publishing to Tableau Public embeds easily and loads fast.
Where it falls short: The name tells you the limitation. Everything you publish on Tableau Public is public. Your dashboards appear in Tableau’s public gallery. Your data is visible to anyone. For personal portfolios and public data projects, that’s fine. For business data — revenue, customers, marketing performance — publishing to a public gallery isn’t an option.
The desktop app also requires Windows or Mac. No browser-based editing. And if you want private dashboards, you’re looking at Tableau Creator at $75/month per user.
Who it’s for: Data practitioners building public portfolios, journalists working with open data, students learning BI.
5. Infograph — Best for Non-Technical Users Who Just Want a Dashboard
Infograph takes a different approach. Instead of learning a tool, you describe what you want.
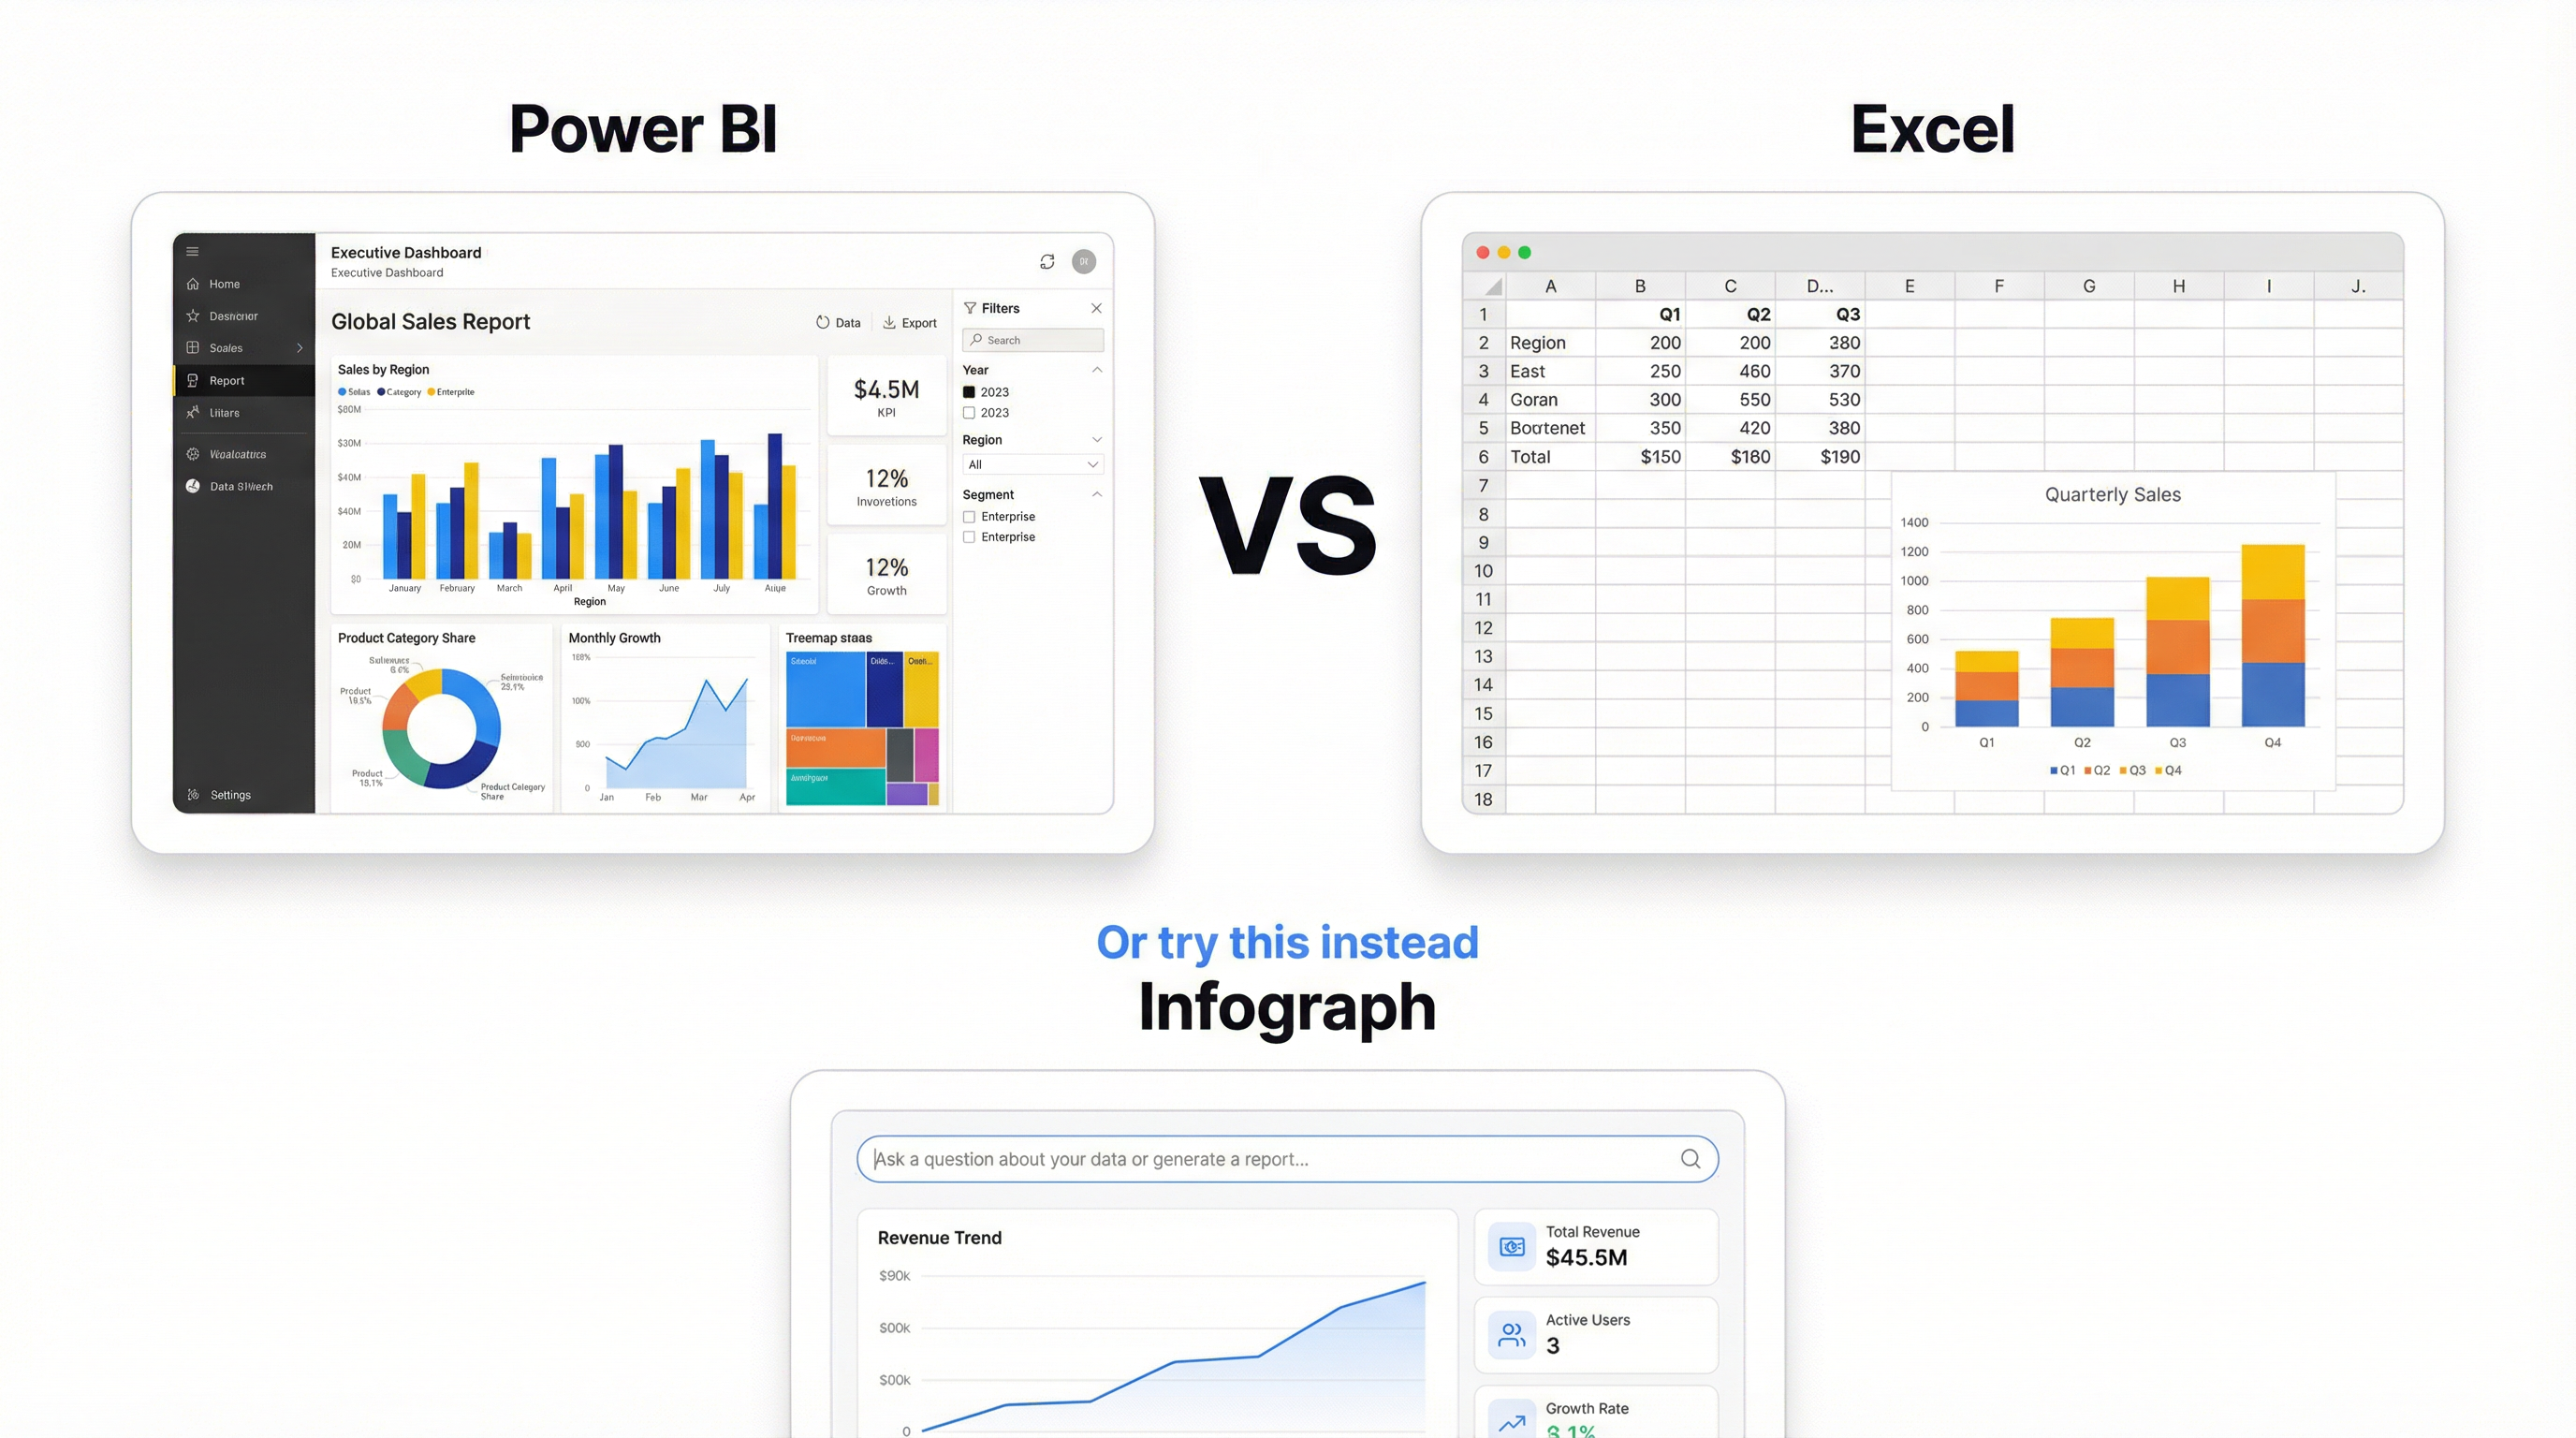
Upload a CSV, connect a Google Sheet, or link an Excel file — then type what you’re looking for. “Show me monthly revenue by product category” or “Which customers have the highest lifetime value?” The AI builds the dashboard. It takes about 8 seconds.
What it does well: The time-to-first-dashboard is the shortest of any tool on this list. There’s no SQL, no drag-and-drop builder, no connector configuration. You bring data, describe the output, and the dashboard appears. For someone who needs answers from data but doesn’t want to become a data analyst to get them, this is genuinely useful.
The free tier is real: one dashboard, no credit card required. The AI credits included are enough to build and iterate on a full dashboard. Sharing works cleanly — public links, password-protected links, or restricted to your team.
Where it falls short: Infograph trades flexibility for speed. Power users who want pixel-perfect control over every chart property will hit limits. If you’re the kind of person who has opinions about axis tick frequency and custom color gradients, you’ll probably want Metabase or Tableau. Infograph is optimized for the person who wants an answer, not the person who wants to build a reporting system.
Who it’s for: Founders, ops teams, and anyone who needs to understand their data without spending hours setting up a BI tool. Also the right choice for teams who want to give non-technical stakeholders self-serve access to data without a technical onboarding process.
The Honest Summary
| Tool | Best For | Actually Free? | Technical Requirement |
|---|---|---|---|
| Metabase | SQL-heavy teams | Self-hosted only | High (DevOps) |
| Looker Studio | Google ecosystem | Yes | Medium |
| Grafana | Infrastructure monitoring | Self-hosted + limited cloud | High |
| Tableau Public | Public data / portfolios | Yes, but data is public | Medium |
| Infograph | Non-technical users | Yes | None |
If you have a database and a developer, Metabase. If you’re all-in on Google, Looker Studio. If you’re monitoring servers, Grafana. If you’re building a public portfolio, Tableau Public.
If you just want to understand your data without becoming a BI engineer, try Infograph.
Where to Start
The fastest way to see if Infograph works for you: upload a file and type a question. No tutorial, no onboarding sequence, no credit card.
If it answers your question in 8 seconds, you’ll know. If it doesn’t, the other tools on this list are genuinely worth your time.