The pitch for real-time dashboards sounds great: everyone on the team sees live data, decisions happen faster, no one’s working off stale numbers. The reality, until recently, was that building one required a data engineer, a BI platform, and a few weeks of setup.
For teams without a dedicated data function — which is most small and mid-size companies — that meant static reports, emailed spreadsheets, and a lot of “what are the latest numbers?”
That’s changed. Here’s what real-time actually means in practice, and how to build it without a data team.
What “real-time” actually means for most teams
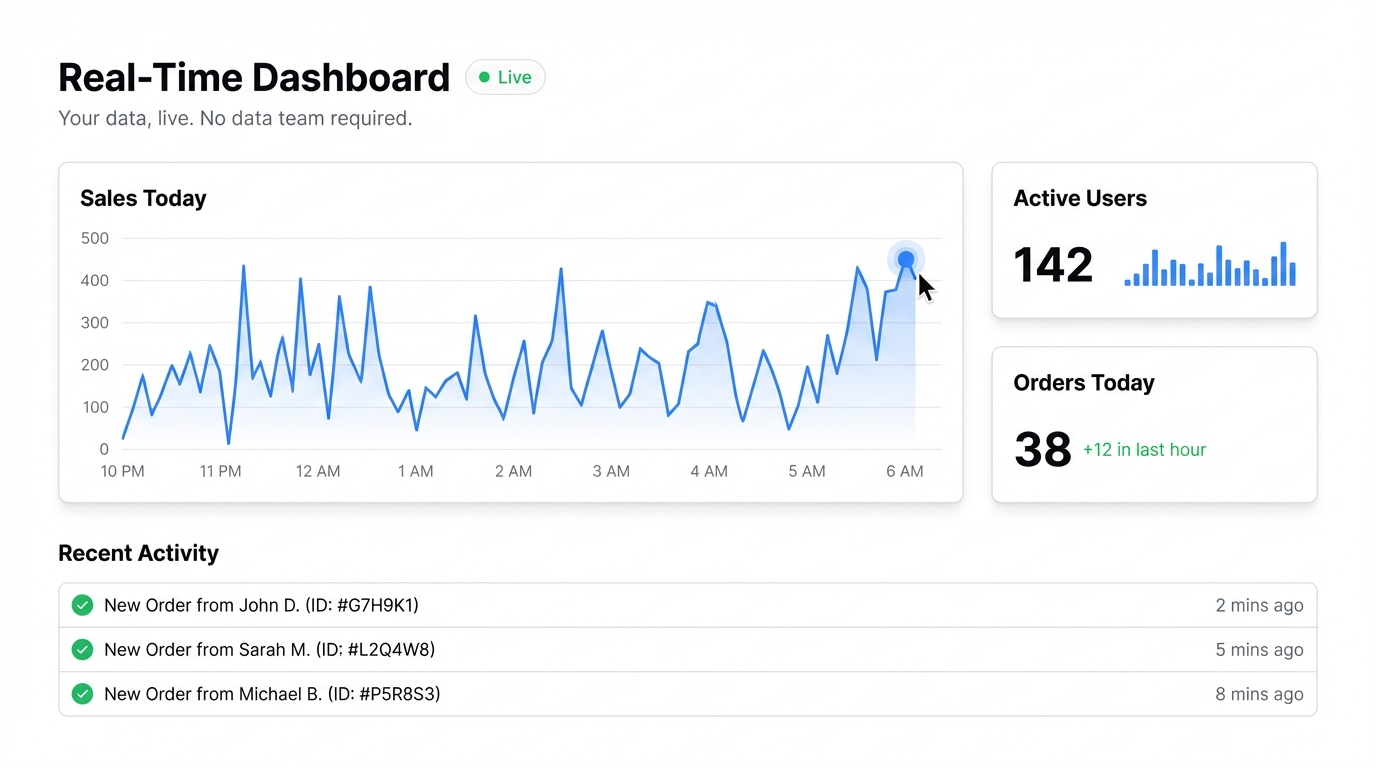
True real-time — data updating millisecond by millisecond — is a requirement for trading desks, e-commerce during flash sales, and operations centers. For most business teams, what you actually need is current.
Current means: when I open this dashboard today, I’m seeing today’s data. Not last week’s report. Not the spreadsheet someone emailed on Friday.
The difference between real-time and current is important because it changes what tools you need. True real-time requires database connections and streaming infrastructure. Current data — which is what most teams actually need — can be delivered by connecting to a live spreadsheet that your team keeps updated, or by making it easy to refresh data regularly.
The Google Sheets approach
For most teams, Google Sheets is already the source of truth. The marketing team tracks campaigns there. Finance tracks expenses there. Operations tracks output there.
The problem isn’t the data. The problem is turning it into something visual that updates automatically when the sheet changes.
Connect your Google Sheet to Infograph as a live data source, and any dashboard you build from it stays current automatically. When a team member updates the sheet, the dashboard reflects it. No re-upload, no rebuild, no “can someone send me the latest?”
Same with Excel Online — if your team works in Microsoft 365, connect your Excel files directly.
This isn’t technically “real-time” in the engineering sense, but for 95% of teams, it’s exactly what they need.
Who this actually works for
Sales teams — connect a Google Sheet with deal data, pipeline stages, and rep performance. The sales manager sees a live pipeline without waiting for a Monday morning report.
Marketing teams — connect campaign data, channel performance, and weekly metrics. Update the sheet after pulling your weekly export from Google Analytics or your ad platform, and the dashboard reflects it immediately.
Operations teams — track production metrics, team output, or customer support volume. Update the sheet daily, and leadership always has current numbers.
Startups — you have data in five different places and no one to wrangle it. A shared Google Sheet that feeds a live dashboard is dramatically better than a static deck you send each Friday.
What to look for in a real-time dashboard builder
If you’re evaluating tools, a few things matter:
Live connections, not just imports. The difference between uploading a file and connecting a live source is huge. With a live connection, you update the data in one place and the dashboard follows. With file uploads, someone has to remember to re-upload every week.
No code required. If building or updating a dashboard requires SQL or developer help, it won’t get used. The tool needs to work for the person who actually owns the data.
Easy sharing. A dashboard that lives on one person’s machine isn’t a team dashboard. You need to share it as a link — ideally with access controls so you can decide who sees what.
Fast setup. If it takes three days to configure, it won’t happen. The tool should go from data to dashboard in minutes.
Building it in practice
Here’s a concrete workflow:
-
Maintain your core metrics in a Google Sheet. This doesn’t need to be automated — even a manually-updated sheet that someone fills in each morning is better than nothing.
-
Connect the sheet to Infograph. Add it as a live data source — takes about a minute.
-
Describe the dashboard you want. “Show weekly performance by channel as a bar chart, total revenue vs target, and conversion rate trend” — the AI builds it from that.
-
Share the link with your team. They can open it any time and see current data. You control whether it’s public, password-protected, or team-only.
When you update the sheet, the dashboard updates. That’s the workflow.
The honest tradeoff
If you need data that updates every second — live transaction feeds, real-time inventory counts, streaming API data — you’ll need a more complex setup. That’s a data engineering problem, not a dashboard problem.
But if your team’s idea of “real-time” is “I want to see today’s numbers, not last week’s spreadsheet” — a connected Google Sheet and a good dashboard builder is everything you need.
Most teams discover that the bottleneck was never the tool. It was the effort required to set one up. When setup takes minutes instead of weeks, the whole team actually uses it.
Build your first live dashboard free at Infograph. Connect your Google Sheet or upload your data and describe what you want to see.