The data exists. You just can’t see it in one place.
Google Ads is in one tab. Meta Business Suite is in another. Google Analytics is somewhere else, along with whatever email platform you use and the LinkedIn campaign manager you check every other week. Pulling together a coherent picture of your marketing performance means either an analyst with a lot of patience or a BI setup that took months to build.
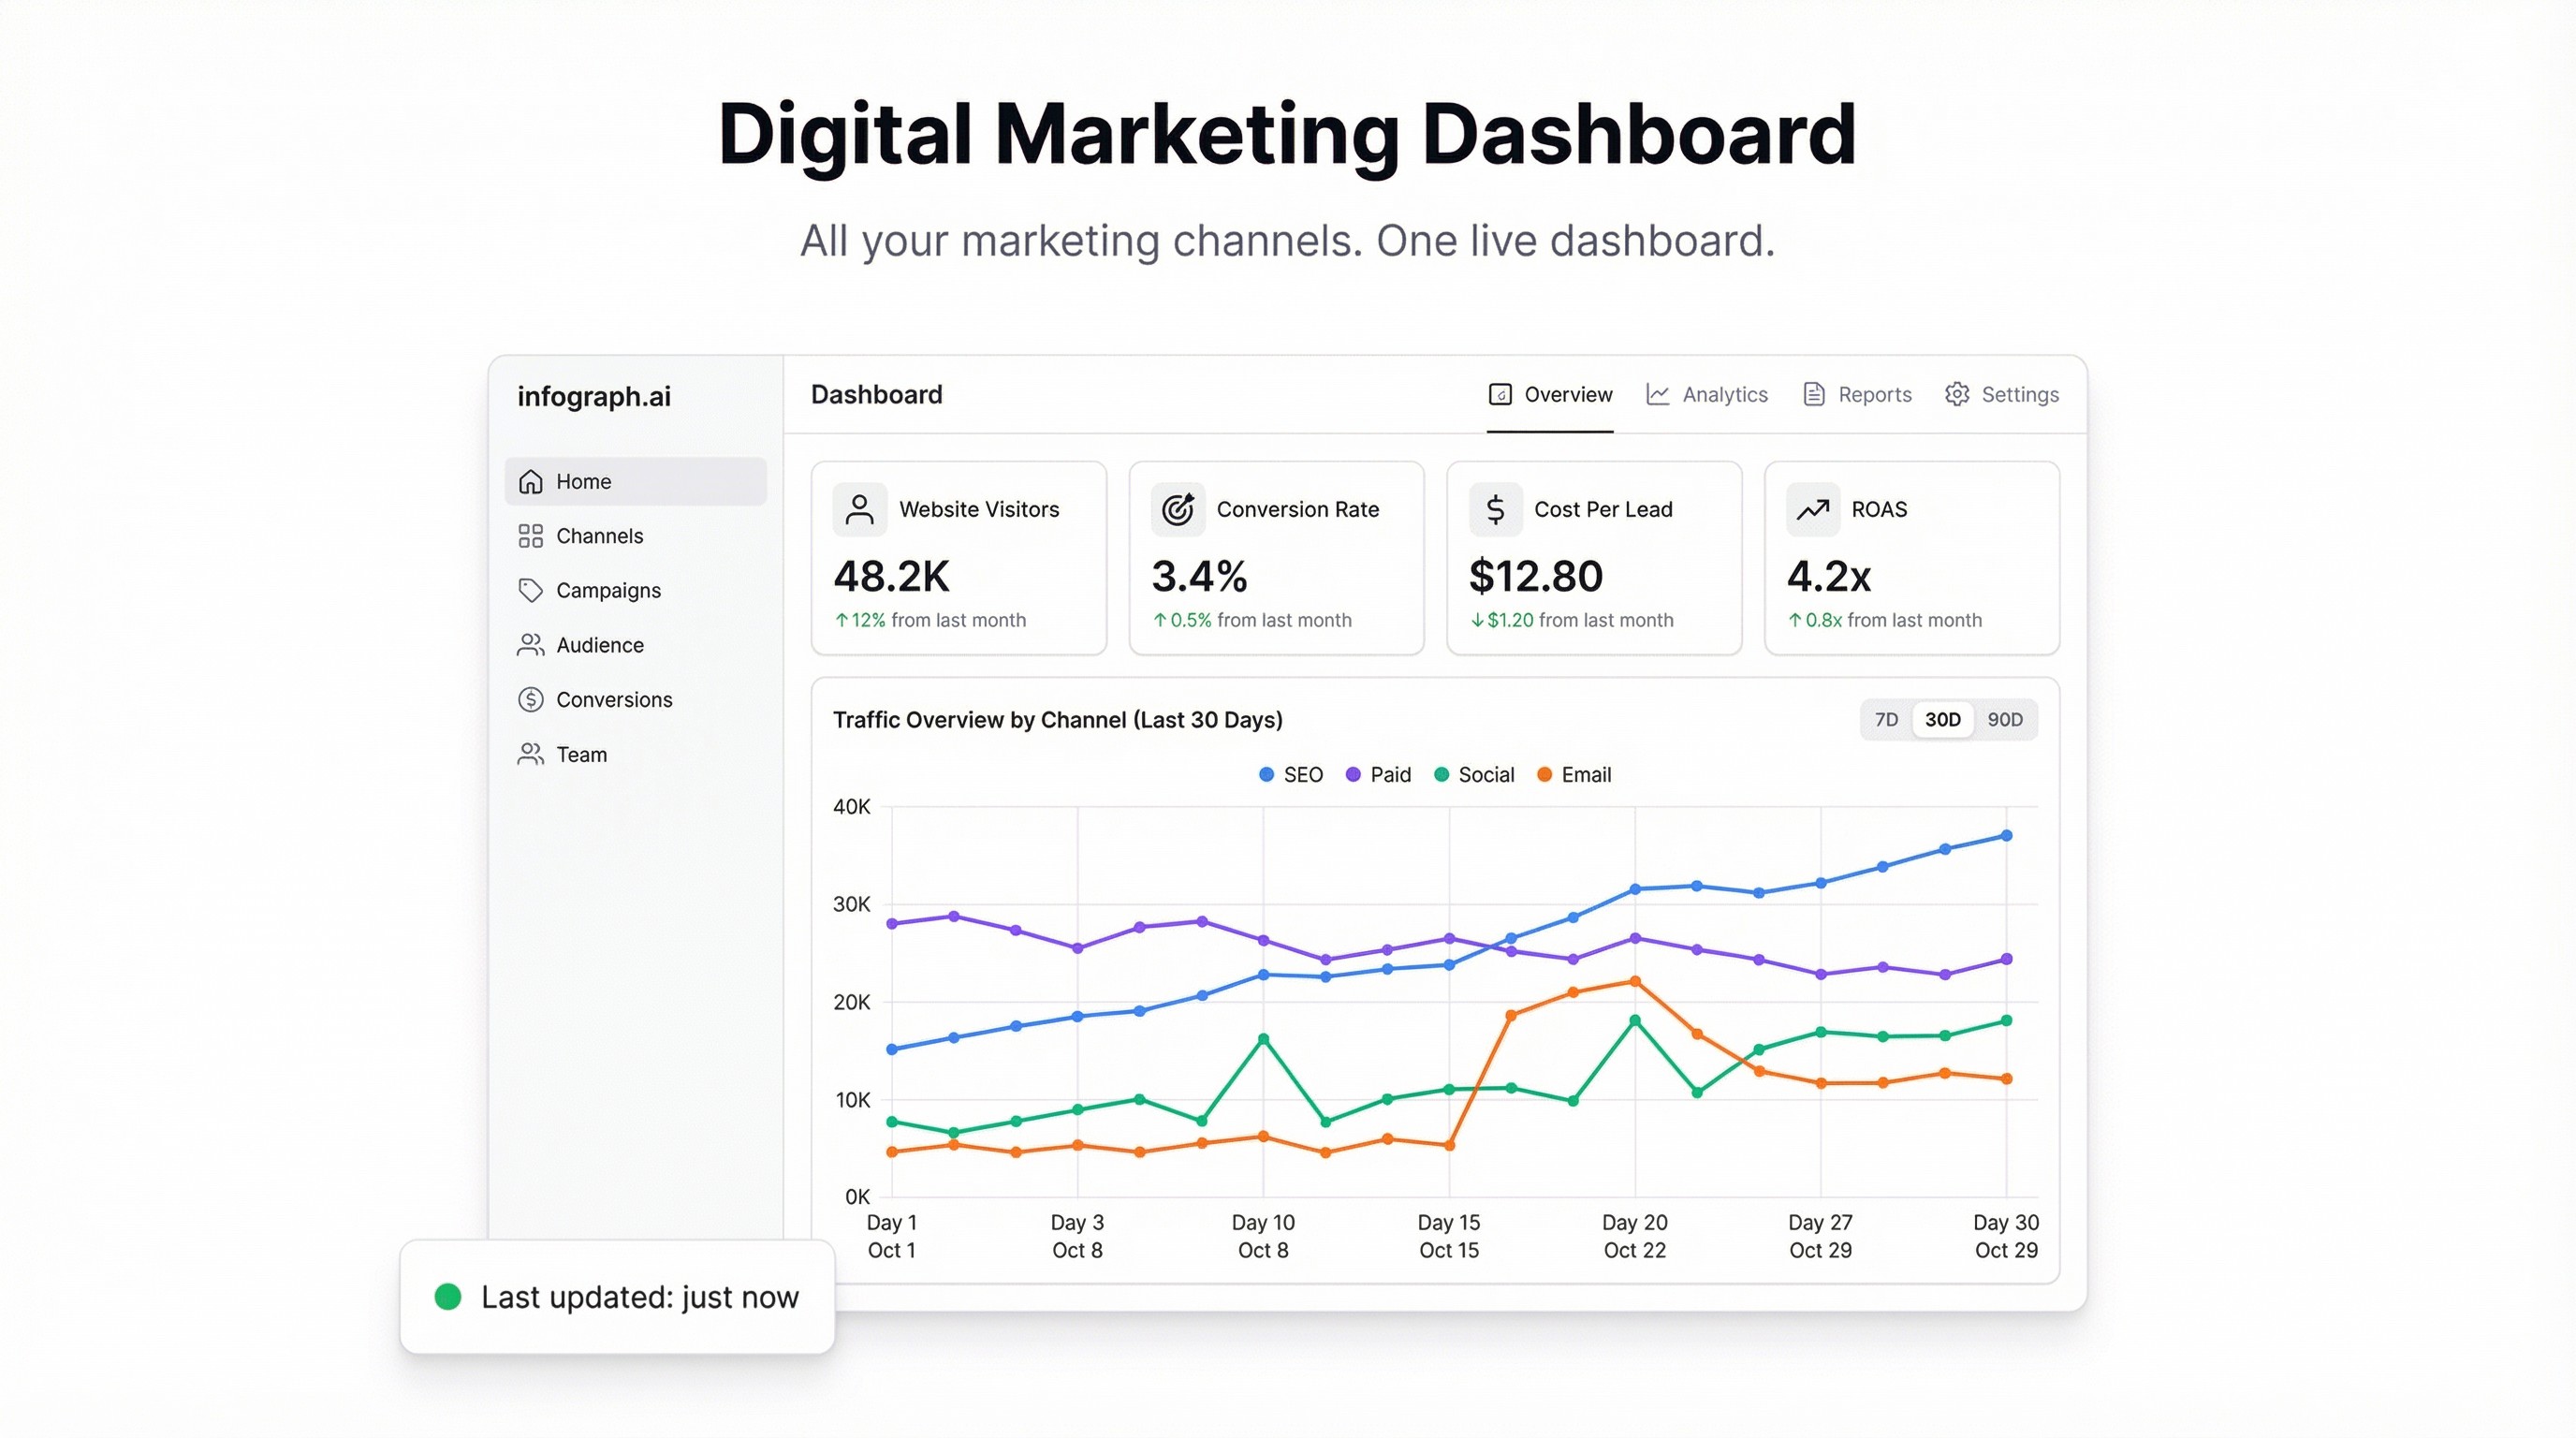
A digital marketing dashboard collapses all of that into a single view. Here’s how to build one that actually works.
What a digital marketing dashboard needs to answer
The questions differ by role. A paid media manager wants CPC, CTR, and ROAS by campaign. A CMO wants total spend, total revenue attributed, and which channels are growing. A founder wants to know if marketing is working.
A good dashboard answers all of them from the same data set:
- Total spend across channels — what did we spend this week/month?
- Channel performance — which channel has the best ROAS? Which is wasting budget?
- Organic vs. paid breakdown — how much traffic are we generating without paying for it?
- Conversion funnel — clicks → leads → customers, by channel
- Cost per acquisition — broken down by campaign, channel, and period
Getting your data in one place
The honest answer: most platforms don’t make this easy via API. But every major ad platform lets you export a CSV, and that’s all you need to start.
Google Ads: Reports → Custom → Download. Export at the campaign level with spend, impressions, clicks, and conversions.
Meta Ads (Facebook/Instagram): Ads Manager → Reports → Export. Same columns — spend, reach, link clicks, and conversion events.
Google Analytics / organic: Export your traffic and conversion data by source/medium. Or use a Google Sheet connected to your GA4 data.
The trick is consistency: use the same time period, the same date column format, and align on your conversion definition across all exports. Once you’ve done that once, it takes five minutes each month.
Building the dashboard
Upload your exports to Infograph and describe what you want:
“Create a digital marketing dashboard. Show total spend by channel as a bar chart. Add a line chart comparing clicks over time for Google Ads vs Meta vs organic. Add KPI cards for total spend, total conversions, and blended CPA.”
Infograph reads the data across all your files and builds the charts. If you’ve connected a Google Sheet that aggregates your channel data, the dashboard stays live as you update it.
The result looks like what you’d get from a BI tool — without the BI tool.
The metrics worth tracking
ROAS (Return on Ad Spend) is the paid media north star. Revenue generated ÷ ad spend. Track it per channel and per campaign. When ROAS drops, you want to catch it before your budget runs out.
Blended CPA tells you what you’re actually paying per customer across all channels. It’s a more honest number than channel-specific CPA, because most conversions are influenced by more than one touchpoint.
Organic share of traffic is a leading indicator of SEO health. If you’re growing paid traffic but organic is flat, you’re buying growth you don’t own. Track both trends.
Click-through rate by channel is worth watching as a creative health signal. A falling CTR on Google Ads usually means ad fatigue. A rising CTR on Meta often signals a creative that’s resonating.
Multi-channel attribution is hard — and that’s okay
Single-source attribution (last click, first click) is a lie everyone agrees to use. The real answer involves multi-touch attribution models that most small teams don’t have the data infrastructure to run.
The pragmatic approach: track all channels, watch blended CPA as your core metric, and use channel-level ROAS as a relative signal rather than an absolute truth. When one channel looks dramatically better than another, investigate — it’s usually a tracking gap or a different funnel stage, not a real efficiency difference.
Sharing with stakeholders
A digital marketing dashboard is most useful when it’s shared. With Infograph, you can:
- Share a live link with your team (updates as you update the data)
- Password-protect it for board or investor access
- Snapshot it for monthly reporting (so the numbers don’t change after you send it)
Weekly marketing reviews become faster when everyone’s looking at the same data before the meeting. Not because the numbers changed — because they’re not arguing about which numbers to look at.
The weekly routine
A useful cadence:
- Export channel data every Monday morning (Google Ads, Meta Ads, GA4)
- Paste into your master sheet or upload to Infograph
- Review the dashboard — flag anything that looks wrong or surprising
- Share to the team Slack / meeting doc
That’s it. No data engineering, no waiting for a report to run, no reconciling numbers from different sources. The dashboard either tells you things are working or it tells you where to look.
Build the dashboard first. The insights follow.


