Most SaaS founders know their MRR to the dollar. Ask them about LTV/CAC ratio, or DAU by cohort, and things get murkier. The data exists — buried in a spreadsheet someone updates on Fridays — but it’s not a dashboard anyone actually checks.
That’s the gap. Not missing data. Missing visibility.
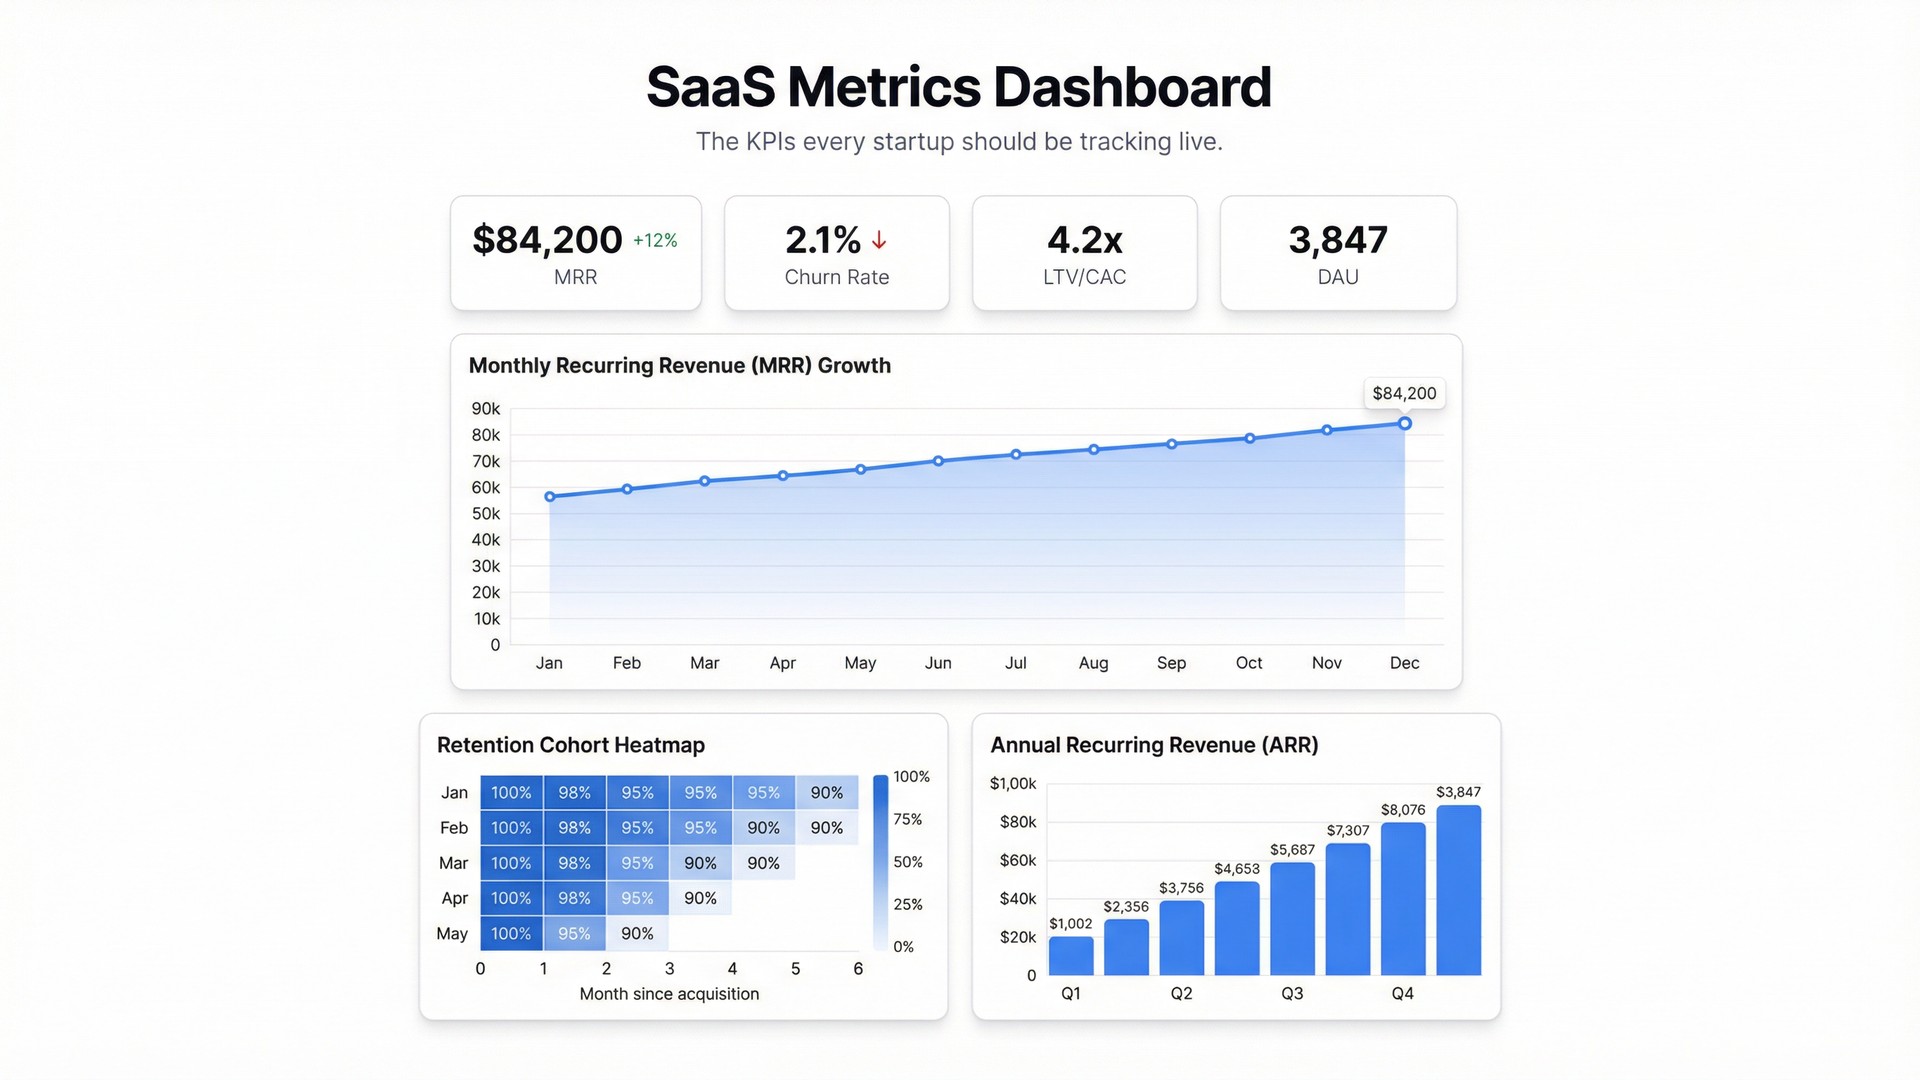
A SaaS metrics dashboard solves that. One screen, always current, showing the numbers that determine whether you have a business or a very expensive hobby.
The metrics that actually matter
There are dozens of SaaS metrics you could track. These are the ones that change decisions.
MRR (Monthly Recurring Revenue) — your pulse. Track it total, by plan tier, and as net new (new MRR minus churned MRR plus expansion MRR). The breakdown is where the signal lives.
ARR (Annual Recurring Revenue) — MRR × 12. Useful for investor conversations and annual planning, but don’t let it distract from the month-to-month reality.
Churn rate — both customer churn (how many accounts left) and revenue churn (how much MRR left). A 5% customer churn rate looks very different if your churned accounts were all on the free plan versus your largest contracts.
LTV/CAC ratio — lifetime value divided by customer acquisition cost. Below 3:1 and your unit economics are broken. Above 5:1 and you’re probably underinvesting in growth.
DAU/MAU — daily active users as a percentage of monthly active users. This ratio tells you about engagement and stickiness, not just whether people signed up.
Net Revenue Retention (NRR) — the one number that tells you whether your existing customers are growing or shrinking. Above 100% means your existing base is expanding. Below 100%, you’re running uphill.
The spreadsheet problem
Most early-stage SaaS companies track these metrics in spreadsheets. One tab for revenue, another for cohorts, a third for whatever someone built last quarter that no one fully understands.
The data is accurate. The problem is access. Updating it requires a specific person with specific knowledge. Viewing it requires opening the right file, knowing which tab matters, and ignoring the tabs that are definitely wrong.
When your metrics dashboard lives in a spreadsheet, it gets checked weekly at best. Usually it gets checked when something already feels wrong — which is exactly when you don’t want to be discovering trends for the first time.
Building a live SaaS dashboard in Infograph
If your metrics live in Google Sheets or Excel, you can connect them directly to Infograph. Once connected, your dashboard updates automatically as your spreadsheet changes — no re-uploading, no manual refresh.
The setup takes about five minutes:
- Connect your Google or Microsoft account to Infograph
- Select the sheet containing your SaaS data
- Describe what you want to see — “MRR by month, churn rate, LTV/CAC, and DAU trend for the last 90 days”
- Infograph builds the dashboard
That last step is where it gets interesting. You describe the dashboard in plain language. The AI figures out which columns map to which metrics, builds the appropriate chart types, and arranges them in a layout that makes sense for the data.
If your MRR data is split across multiple tabs, or if your churn calculations live in a formula column that references another sheet, Infograph handles it. You don’t need to clean the data or restructure anything first.
What the dashboard should actually show
A good SaaS metrics dashboard isn’t a wall of numbers. It’s structured around the questions your team asks every week.
Put MRR trend front and centre — a line chart, last 12 months, with net new MRR overlaid. This single view tells the story of whether the business is growing, stalling, or declining.
Below that: churn rate as a rolling average (monthly churn is noisy; a 3-month average smooths it out without hiding real problems), LTV/CAC as a single number with a historical trend, and DAU/MAU as a ratio.
Save the detailed cohort analysis for a second screen or a drilldown. The top-level dashboard should answer “how are we doing?” in about 10 seconds.
Sharing it with your team
Once built, publish the dashboard and share the link with your co-founder, your investors, your team leads. Infograph lets you set it to team-only access — so it’s not public, but anyone on your account can open it without needing to know which spreadsheet to look in or which tab has the right numbers.
When the underlying Google Sheet updates, the dashboard updates. Your weekly metrics review becomes a conversation about what the numbers mean, not a session of pulling data together.
The metrics that define your SaaS business deserve better than a Friday spreadsheet ritual. Build the dashboard once, and the data does the rest.


