The problem with KPI lists isn’t that they’re too short. It’s that they’re usually just lists — metrics without context, without guidance on what to actually track vs. what to collect and ignore.
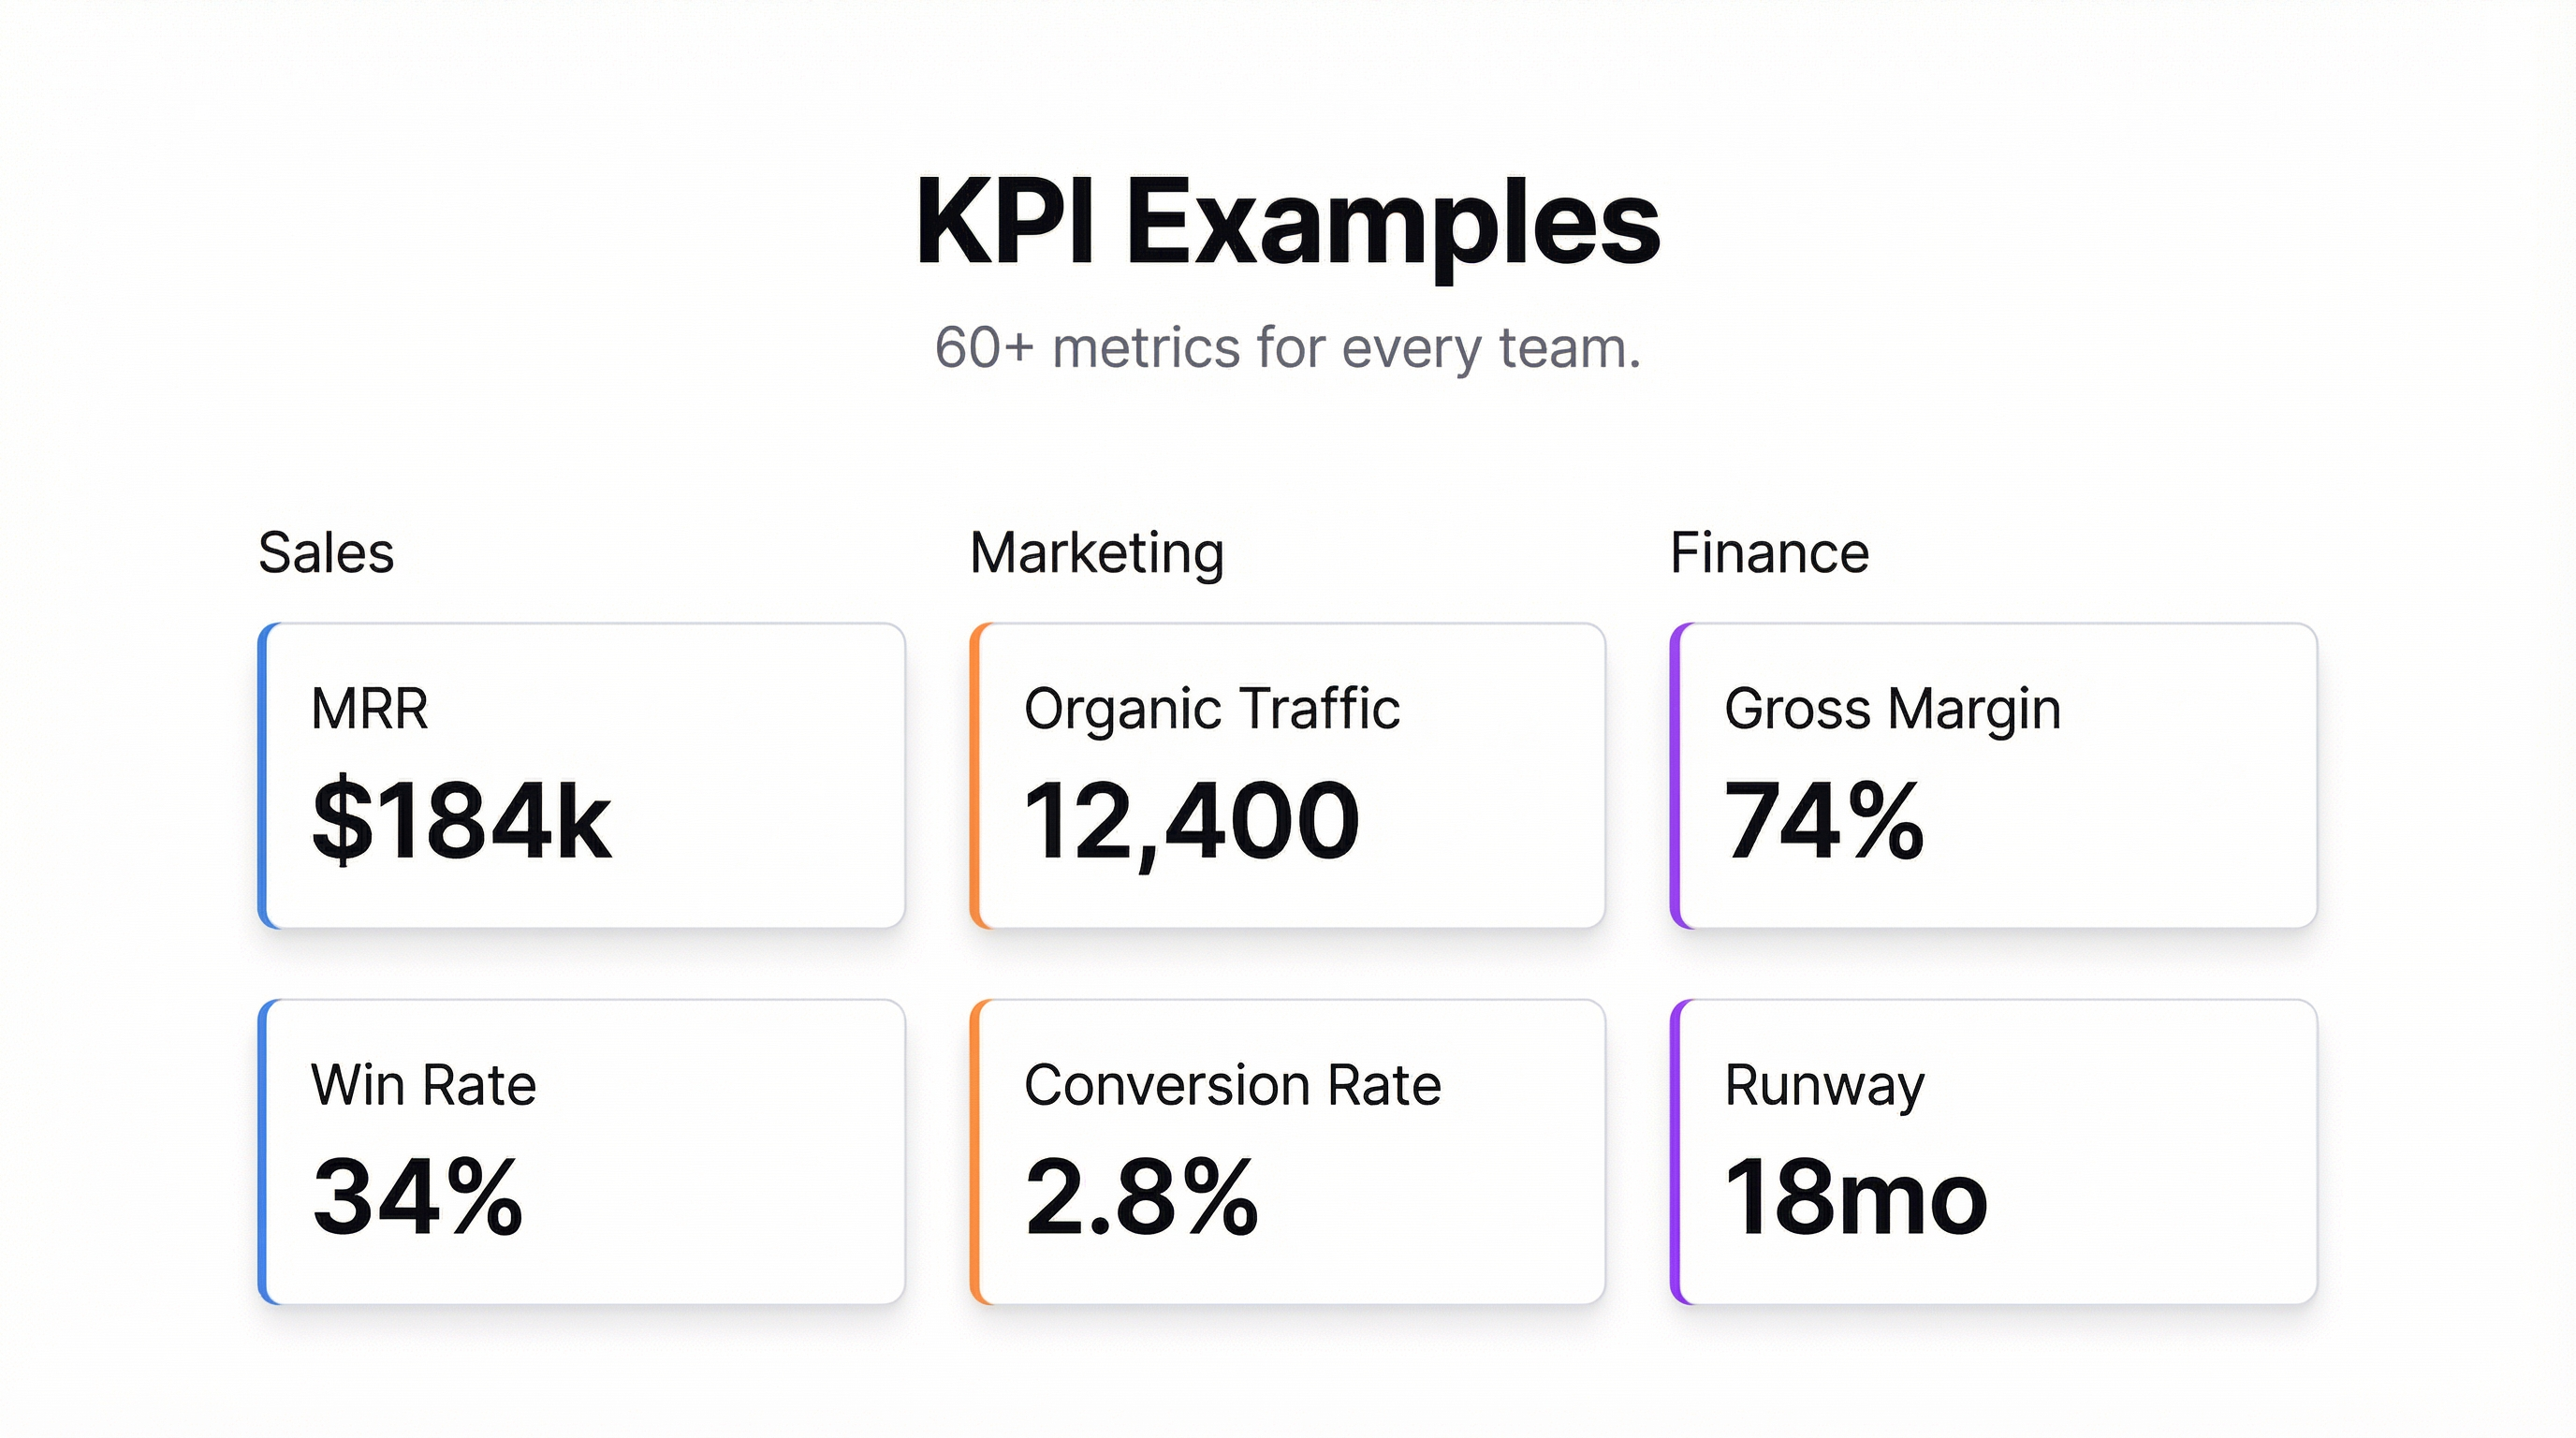
This guide gives you 60+ KPI examples across the teams that use them most. But more useful than the list: some notes on which metrics actually predict outcomes vs. which ones just feel important.
Sales KPIs
Sales teams tend to track too many metrics and pay attention to too few. The ones that matter most are the ones that predict revenue, not the ones that measure activity.
- Monthly recurring revenue (MRR) — the baseline for any subscription business
- MRR growth rate — month-over-month percentage change; more useful than raw MRR for spotting trends
- Pipeline value — total value of deals in active stages
- Win rate — percentage of opportunities that close; low win rate often signals qualification problems
- Average deal size — useful for forecasting; sudden drops often indicate competitive pressure
- Sales cycle length — time from first contact to close; longer cycles = more forecast uncertainty
- Quota attainment — percentage of reps hitting quota; a team metric, not just individual
- Lead-to-close rate — end-to-end conversion from lead to customer
- Customer acquisition cost (CAC) — fully-loaded cost to acquire one new customer
- CAC payback period — months to recover CAC from gross margin; under 12 months is healthy for SaaS
Marketing KPIs
Marketing KPIs often get confused between vanity metrics and ones that actually predict growth.
- Website visitors (unique) — monthly unique visitors as a baseline
- Organic traffic — visits from search; the compounding metric for content investment
- Traffic by channel — breaks down organic, paid, social, direct, referral
- Conversion rate — visitors to leads; even a 0.5% improvement compounds significantly
- Cost per lead (CPL) — total marketing spend divided by leads generated
- Marketing qualified leads (MQLs) — leads that meet criteria for sales follow-up
- Email open rate — engagement benchmark; above 25% is good for B2B
- Click-through rate (CTR) — email or ad clicks / impressions
- Keyword rankings — positions for target search terms; directional trend matters more than individual positions
- Branded vs. non-branded search split — high branded share signals awareness; high non-branded signals content traction
- Return on ad spend (ROAS) — revenue generated per dollar of ad spend
Finance KPIs
- Revenue — total, by product line, by region
- Gross margin — revenue minus cost of goods sold; for SaaS, typically 70-85%
- Net margin — what’s left after all costs; negative is fine for early-stage startups, not for mature ones
- Burn rate — monthly net cash outflow
- Runway — months of cash remaining at current burn rate
- Accounts receivable days (AR days) — average time to collect payment; rising AR days signal collection problems
- Operating cash flow — actual cash generated from operations, excluding financing
- Budget variance — actuals vs. budget by category; identifies where forecasts are consistently off
- Revenue per employee — revenue divided by headcount; efficiency benchmark for team sizing decisions
Operations KPIs
Operations metrics vary by industry, but these apply broadly.
- On-time delivery rate — percentage of orders/projects delivered on time
- Error or defect rate — percentage of outputs with quality issues
- Cycle time — time to complete one unit of work end-to-end
- Throughput — units processed per time period
- Utilization rate — capacity used vs. available; high utilization in services often signals a hiring need
- Inventory turnover — for physical products; how quickly inventory cycles
- Cost per unit — fully-loaded cost to produce one unit of output
- SLA compliance rate — percentage of commitments met within agreed timelines
Customer Success KPIs
- Net Revenue Retention (NRR) — revenue from existing customers including expansion and churn; above 100% means the existing base is growing
- Gross Revenue Retention (GRR) — revenue retained excluding expansion; pure churn metric
- Churn rate — percentage of customers or revenue lost in a period
- Customer Health Score — composite score based on product usage, support history, and engagement; predicts renewal risk
- Time to first value — how long new customers take to reach their first meaningful outcome
- Product adoption rate — percentage of customers using key features; low adoption predicts churn
- Net Promoter Score (NPS) — likelihood to recommend; industry context matters (B2B SaaS average is around 30-40)
- Support ticket volume — total and per-customer; rising volume often signals product friction
- First response time — time from ticket creation to first response
- CSAT score — customer satisfaction rating on support interactions
HR and People KPIs
- Headcount — total, by department, by location
- Headcount growth rate — month-over-month hiring pace
- Employee turnover rate — employees who left / average headcount; above 20% annually is a warning sign
- Voluntary turnover rate — separates resignations from terminations; the number that matters for retention
- Time to hire — days from job posting to offer acceptance
- Offer acceptance rate — percentage of offers accepted; drops signal compensation or process problems
- Employee NPS (eNPS) — internal version of NPS; “how likely are you to recommend this company as a place to work?”
- Revenue per employee — efficiency metric that improves as the business scales
- Absenteeism rate — unplanned absences as a percentage of working days
Product KPIs
- Daily active users (DAU) — users who take a meaningful action on a given day
- Monthly active users (MAU) — DAU/MAU ratio signals engagement depth; above 20% is good
- Feature adoption rate — percentage of users who have used a given feature
- Activation rate — percentage of new signups that reach the “aha moment” within the first session or week
- Retention by cohort — percentage of users from a given signup month still active at 30, 60, 90 days
- Time in app — average session duration; context-dependent (high is good for engagement tools, less so for utility tools)
- Error rate — technical errors encountered per session
- Net Promoter Score — product-specific, separate from company NPS
How to Track KPIs Without Spreadsheet Hell
A KPI list is only useful if you’re actually looking at it. Most teams end up with KPIs scattered across exports from different tools — revenue in Stripe, traffic in Google Analytics, product metrics in Mixpanel, HR data in a spreadsheet.
The fix isn’t a bigger spreadsheet. It’s a dashboard that pulls everything into one view, updates automatically, and gives you context — targets, trends, comparisons — not just raw numbers.
Infograph connects to the data sources you already use. Upload a CSV or connect a live Google Sheet or Excel file. Describe what you want to see — “show me MRR, churn, and NRR for the last 6 months” — and the dashboard builds from your data.
No formulas. No manual updates. The kind of KPI dashboard that actually gets used.