Looker Studio (formerly Google Data Studio) is genuinely good at one thing: turning Google Analytics data into shareable reports. If your data lives in GA4, Google Ads, or BigQuery, it’s a hard tool to beat — especially at free.
But most teams aren’t Google-first. They’re working from spreadsheets, CSVs, CRMs, and databases. And that’s where Looker Studio starts to show its cracks: slow drag-and-drop builds, a connector ecosystem that feels bolted on, no AI assistance, and sharing controls that haven’t kept pace with how modern teams actually collaborate.
If you’ve hit one of those walls, here’s an honest breakdown of the best alternatives — and which one fits your situation.
At a Glance
| Tool | Free Tier | Setup Time | AI Generation | Live Data | Best For |
|---|---|---|---|---|---|
| Looker Studio | Yes (unlimited) | Hours | No | Google sources only | Google Analytics reporting |
| Tableau | 14-day trial | Days | Limited | Yes | Enterprise BI, data teams |
| Power BI | Yes (limited) | Hours–Days | Copilot (paid) | Yes | Microsoft-heavy orgs |
| Metabase | Yes (self-hosted) | Hours | No | Yes (databases) | SQL-fluent teams |
| Infograph | Yes (1 dashboard) | Seconds | Yes | Yes (Sheets, Excel) | Non-technical teams, fast dashboards |
Tableau
Tableau is the gold standard for data visualization — powerful, flexible, and trusted by analysts at Fortune 500 companies. If your team has dedicated data staff and complex reporting requirements, it earns its reputation.
Pros:
- Best-in-class chart variety and customization
- Strong support for large, complex datasets
- Tableau Public offers free publishing for public data
Cons:
- Steep learning curve — expect days, not hours, to get productive
- Creator licenses start at $75/user/month
- Overkill for most small-to-mid-sized teams
- No AI-driven dashboard generation
Best for: Enterprise data teams that need deep analytical flexibility and have budget to match.
Power BI
Microsoft’s answer to Tableau, and a genuinely strong one. If your organization already runs on Microsoft 365, Power BI integrates smoothly — Excel, SharePoint, Teams, Azure. The free tier is surprisingly capable for personal use.
Pros:
- Tight Microsoft ecosystem integration
- Free desktop version; Pro at $10/user/month is reasonable
- Copilot AI features (on premium plans) are getting better
- Good community and documentation
Cons:
- Desktop-first app — web experience is limited
- Sharing requires Pro licenses on both ends
- The learning curve is real: DAX formulas, data models, relationships
- AI features locked behind premium pricing
Best for: Microsoft-centric organizations with technical users comfortable with data modeling.
Metabase
Metabase hits a sweet spot between no-code tools and full BI platforms. It’s open-source, self-hostable, and designed to make SQL queries approachable. The hosted version (Metabase Cloud) starts at $500/month, but self-hosting is free.
Pros:
- Open source with an active community
- “Ask a question” UI works without SQL knowledge
- Solid database connectivity (Postgres, MySQL, BigQuery, Snowflake, and more)
- Dashboards are clean and shareable
Cons:
- Self-hosting requires engineering setup and maintenance
- No AI generation — you’re still building charts manually
- Cloud pricing is steep for small teams
- Primarily built for database users, not spreadsheet users
Best for: Technical teams with database access who want to democratize data without paying enterprise prices.
Infograph
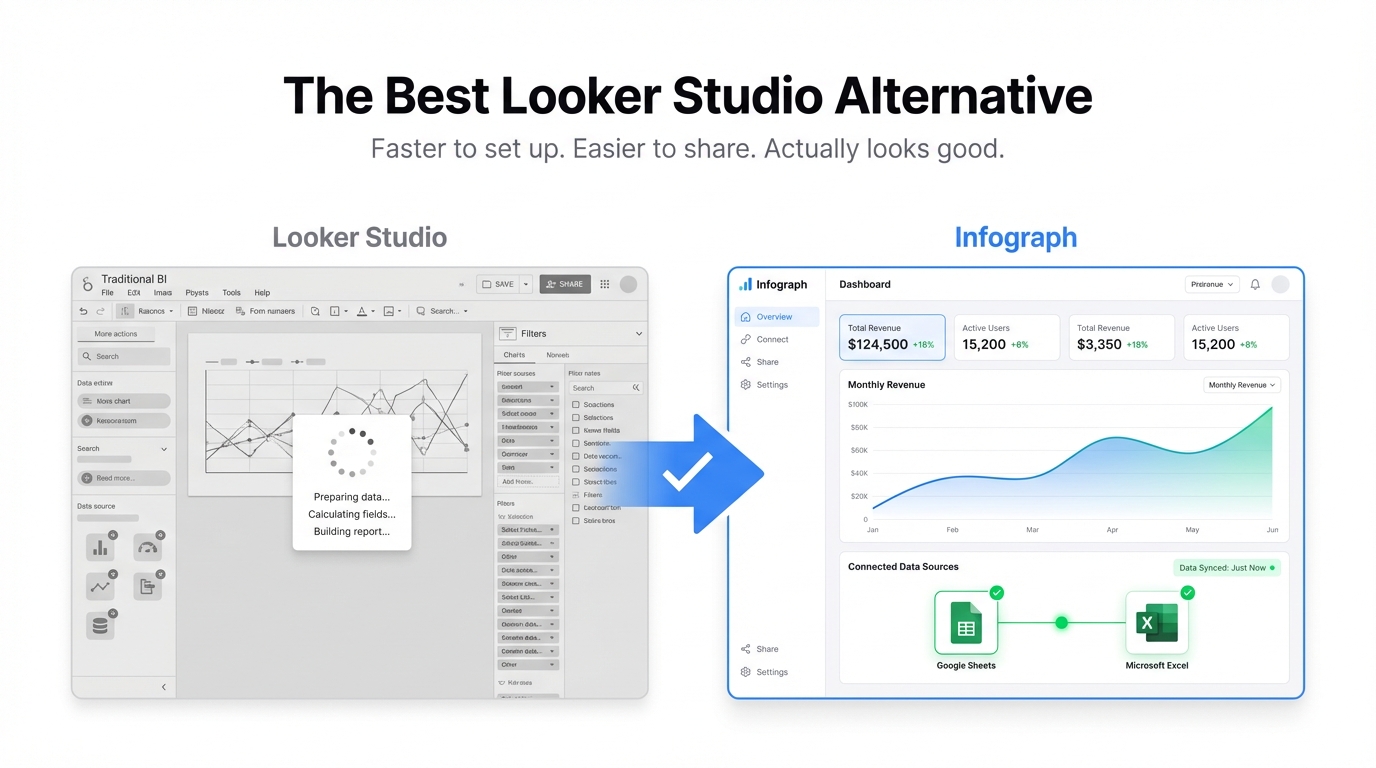
Infograph is built for a different use case than the tools above: non-technical teams who have data in spreadsheets and need dashboards fast — without learning DAX, building data models, or writing SQL.
You upload a CSV or connect a Google Sheet or Excel file, describe the dashboard you want in plain English, and AI builds it. Not a rough draft — an actual dashboard with the right charts, metrics, and layout.
Pros:
- AI generates the full dashboard from a prompt — seconds, not hours
- Works with files you already have (CSV, Excel, Google Sheets)
- Live data connections: update your Google Sheet, dashboard updates automatically
- Clean sharing controls: public, password-protected, or team-only
- Free tier with no credit card required
Cons:
- Not designed for SQL databases or large enterprise data warehouses
- Less chart customization than Tableau or Power BI
- Best suited for business dashboards, not deep statistical analysis
Best for: Founders, operations teams, and analysts who need business dashboards from spreadsheet data — without the learning curve.
Which One Should You Choose?
- Stick with Looker Studio if your data is entirely in the Google ecosystem and you’re happy building manually.
- Choose Tableau if you have a dedicated data team, complex analytical needs, and enterprise budget.
- Choose Power BI if your org is Microsoft-first and your team is technical enough to handle data modeling.
- Choose Metabase if you have database access, some SQL knowledge, and want an open-source option.
- Choose Infograph if you’re working from spreadsheets or CSVs, want dashboards in seconds, and don’t want to spend a week learning a BI tool.
The right tool isn’t the most powerful one — it’s the one your team will actually use. For most small-to-mid-sized teams, that means something fast, approachable, and built around the data they already have.


