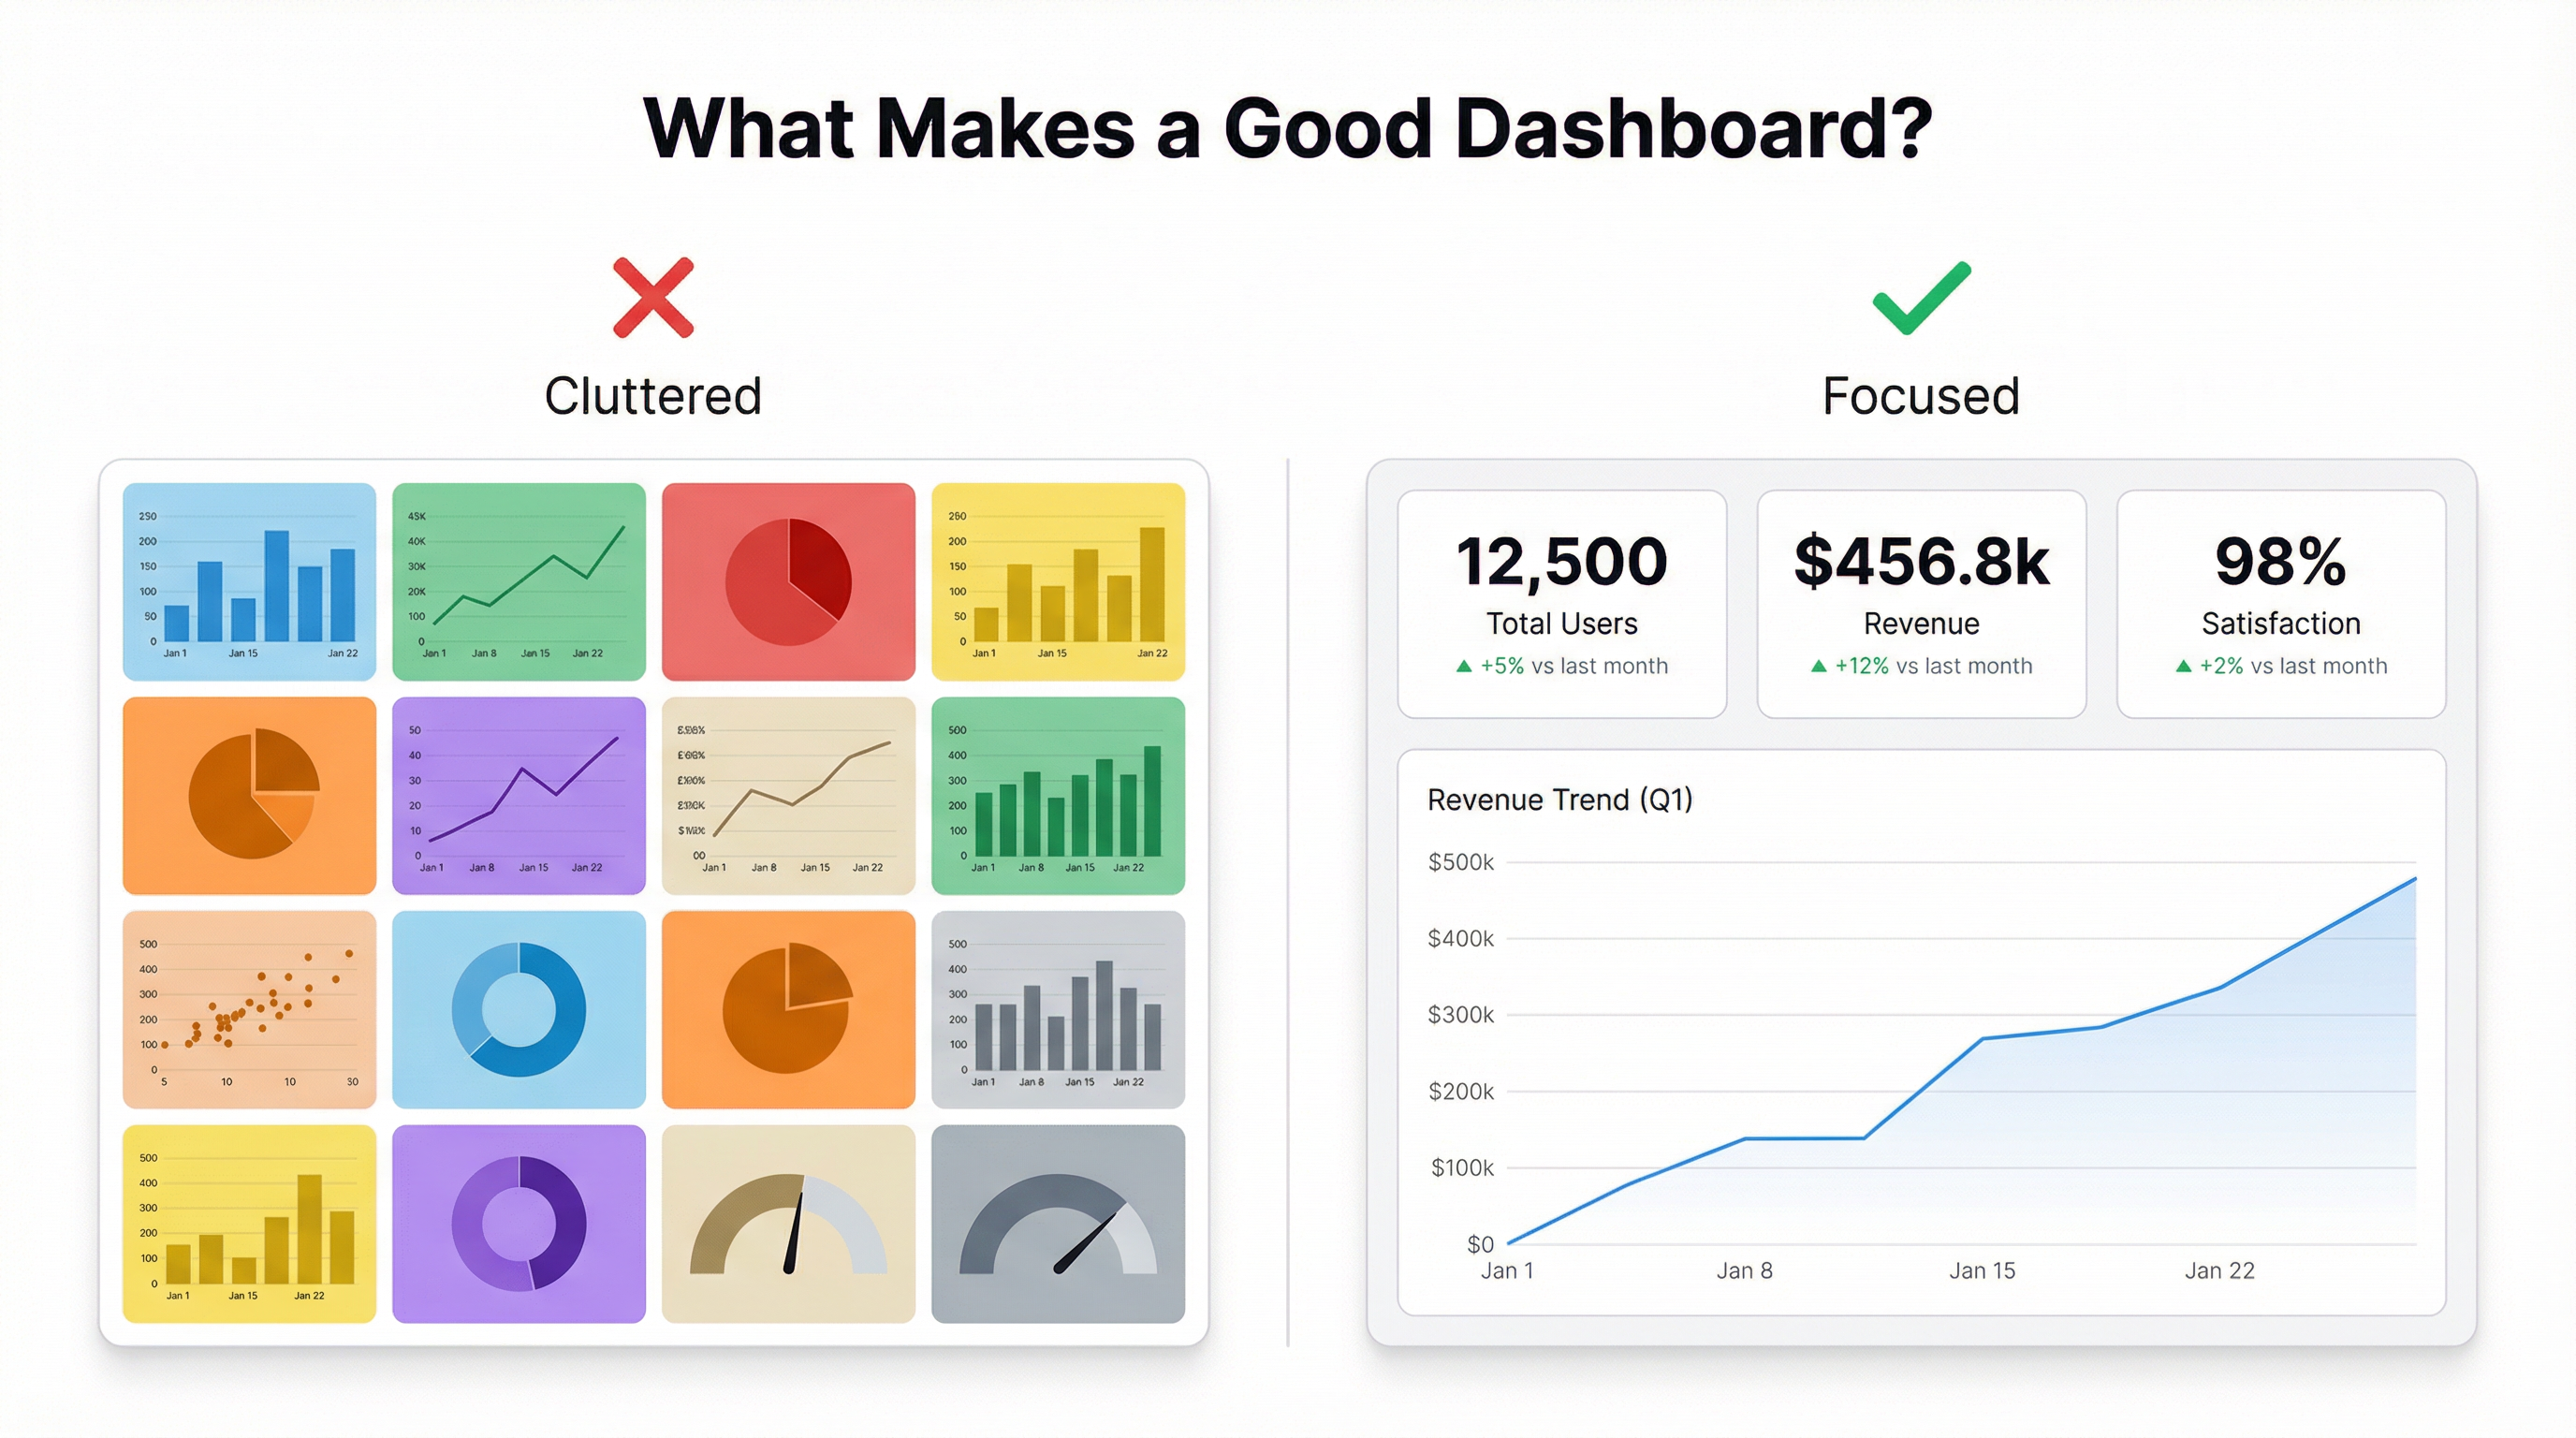
Most dashboards fail the same way. They show everything. They help with nothing.
Someone spent a week building it, pulled every metric they could think of into a grid of charts, and the result is a page that’s technically accurate and completely useless. Nobody knows which number to look at first. Nobody knows what action any of this data is supposed to drive. It gets checked once, bookmarked, and never opened again.
Here’s what actually separates a dashboard that gets used from one that gets ignored.
1. It Has One Job
A dashboard that tries to show everything — revenue, ops, marketing, support, HR — is not a dashboard. It’s a data dump.
Good dashboards have an audience and a question. The sales team’s dashboard answers “how are we tracking against quota?” The CFO’s dashboard answers “are we going to run out of money?” The marketing dashboard answers “which campaigns are generating pipeline?”
One audience. One question. When you’re clear about both, every metric you add is either clearly necessary or obviously distracting.
2. It Opens at the Right Level of Detail
The first thing you see when you open a dashboard should be the high-level answer. Then you drill down if something looks wrong.
A dashboard that opens with a table of 200 customer records is not designed for decision-making — it’s designed for data exploration. That’s a different tool.
Start with KPIs and trend lines. Build in the ability to drill down. But make the summary the first thing visible, not an afterthought at the top of a long scroll.
3. The Most Important Number Is the Biggest Thing on the Screen
Visual hierarchy is everything. If revenue is the metric that matters most, it should be the first thing your eye goes to. Not because of the label — because of its size, weight, and position on screen.
Most people build dashboards where every metric has equal visual priority. Equal priority means no priority. The dashboard is just a grid of numbers with no sense of what actually matters.
Pick the one or two metrics that, if they moved, would change what you do today. Make those dominant. Let everything else support them.
4. It Updates Without Anyone Touching It
A dashboard that requires a manual export to stay current is not a dashboard. It’s a report that someone might or might not remember to run.
Live data connections aren’t a nice-to-have — they’re the baseline requirement for a dashboard to be worth building. If your Google Sheets updates and your dashboard doesn’t, the dashboard immediately becomes less trustworthy and less used. People stop checking it because they can’t be sure it’s current.
Connect to your data source directly. Set it to refresh automatically. Eliminate the manual step.
5. Every Chart Answers a Specific Question
Before adding any chart, ask: what question does this chart answer? And who is asking that question?
If you can’t answer both parts — what question and who’s asking — don’t add the chart. A bar chart showing monthly revenue is not a question. “Is revenue growing at the rate we need to hit our end-of-year target?” is a question. The chart should be designed to answer that specific question, not to show revenue in general.
This also means that chart types matter. A line chart answers “how is this trending?” A bar chart answers “how does this compare across categories?” A number card answers “what is this right now?” Choose the chart type based on the question, not based on what looks impressive.
6. It’s Readable Without an Explanation
If you have to walk someone through your dashboard to make it useful, it isn’t finished.
Every axis should be labeled. Every number should have its unit (dollars, not just “1.2M”). Color-coding should be consistent. Time periods should be explicit — “last 30 days” not just the raw date range.
The person opening this dashboard at 7am before a board call shouldn’t need to look anything up. The dashboard itself should contain every piece of context needed to interpret what they’re seeing.
7. It Shows Change, Not Just State
“Revenue is $1.2M” is state. “Revenue is $1.2M, up 18% from last month and 12% ahead of the same period last year” is change.
State tells you where you are. Change tells you whether you should be worried.
Good dashboards always show the current value in context. Trend lines, period comparisons, target tracking, percentage changes — the metric plus its direction is what drives decisions. The metric alone is just a number.
The dashboards that get used share one thing: they were built with a specific decision in mind, not as a general-purpose display of available data.
The fastest way to build a dashboard like this is to describe the decision it needs to support, then work backwards to the metrics. Infograph lets you do exactly that — upload your data, describe what you want to see, and the AI builds a dashboard around your actual question. Try it free.