The spreadsheet wars have been raging for years. But when it comes to powering live dashboards, the choice depends on your specific situation.
Google Sheets: The Collaboration Champion
Best for:
- Teams that need real-time collaboration
- Data that changes frequently throughout the day
- Organizations already using Google Workspace
Strengths:
- Instant syncing — changes appear immediately
- Easy sharing with granular permissions
- Works anywhere with a browser
- Native integrations with Google’s ecosystem
Limitations:
- Performance degrades with very large datasets (100k+ rows)
- Fewer advanced formula options than Excel
- Requires internet connection
Excel (Microsoft 365): The Power User’s Choice
Best for:
- Complex calculations and data modeling
- Large datasets that need local processing
- Organizations standardized on Microsoft 365
Strengths:
- Handles millions of rows without breaking a sweat
- Superior formula library and calculation engine
- Power Query for advanced data transformation
- Works offline with cloud sync
Limitations:
- Real-time collaboration can feel laggy
- File-based sharing is messier than link sharing
- Mobile experience isn’t as smooth
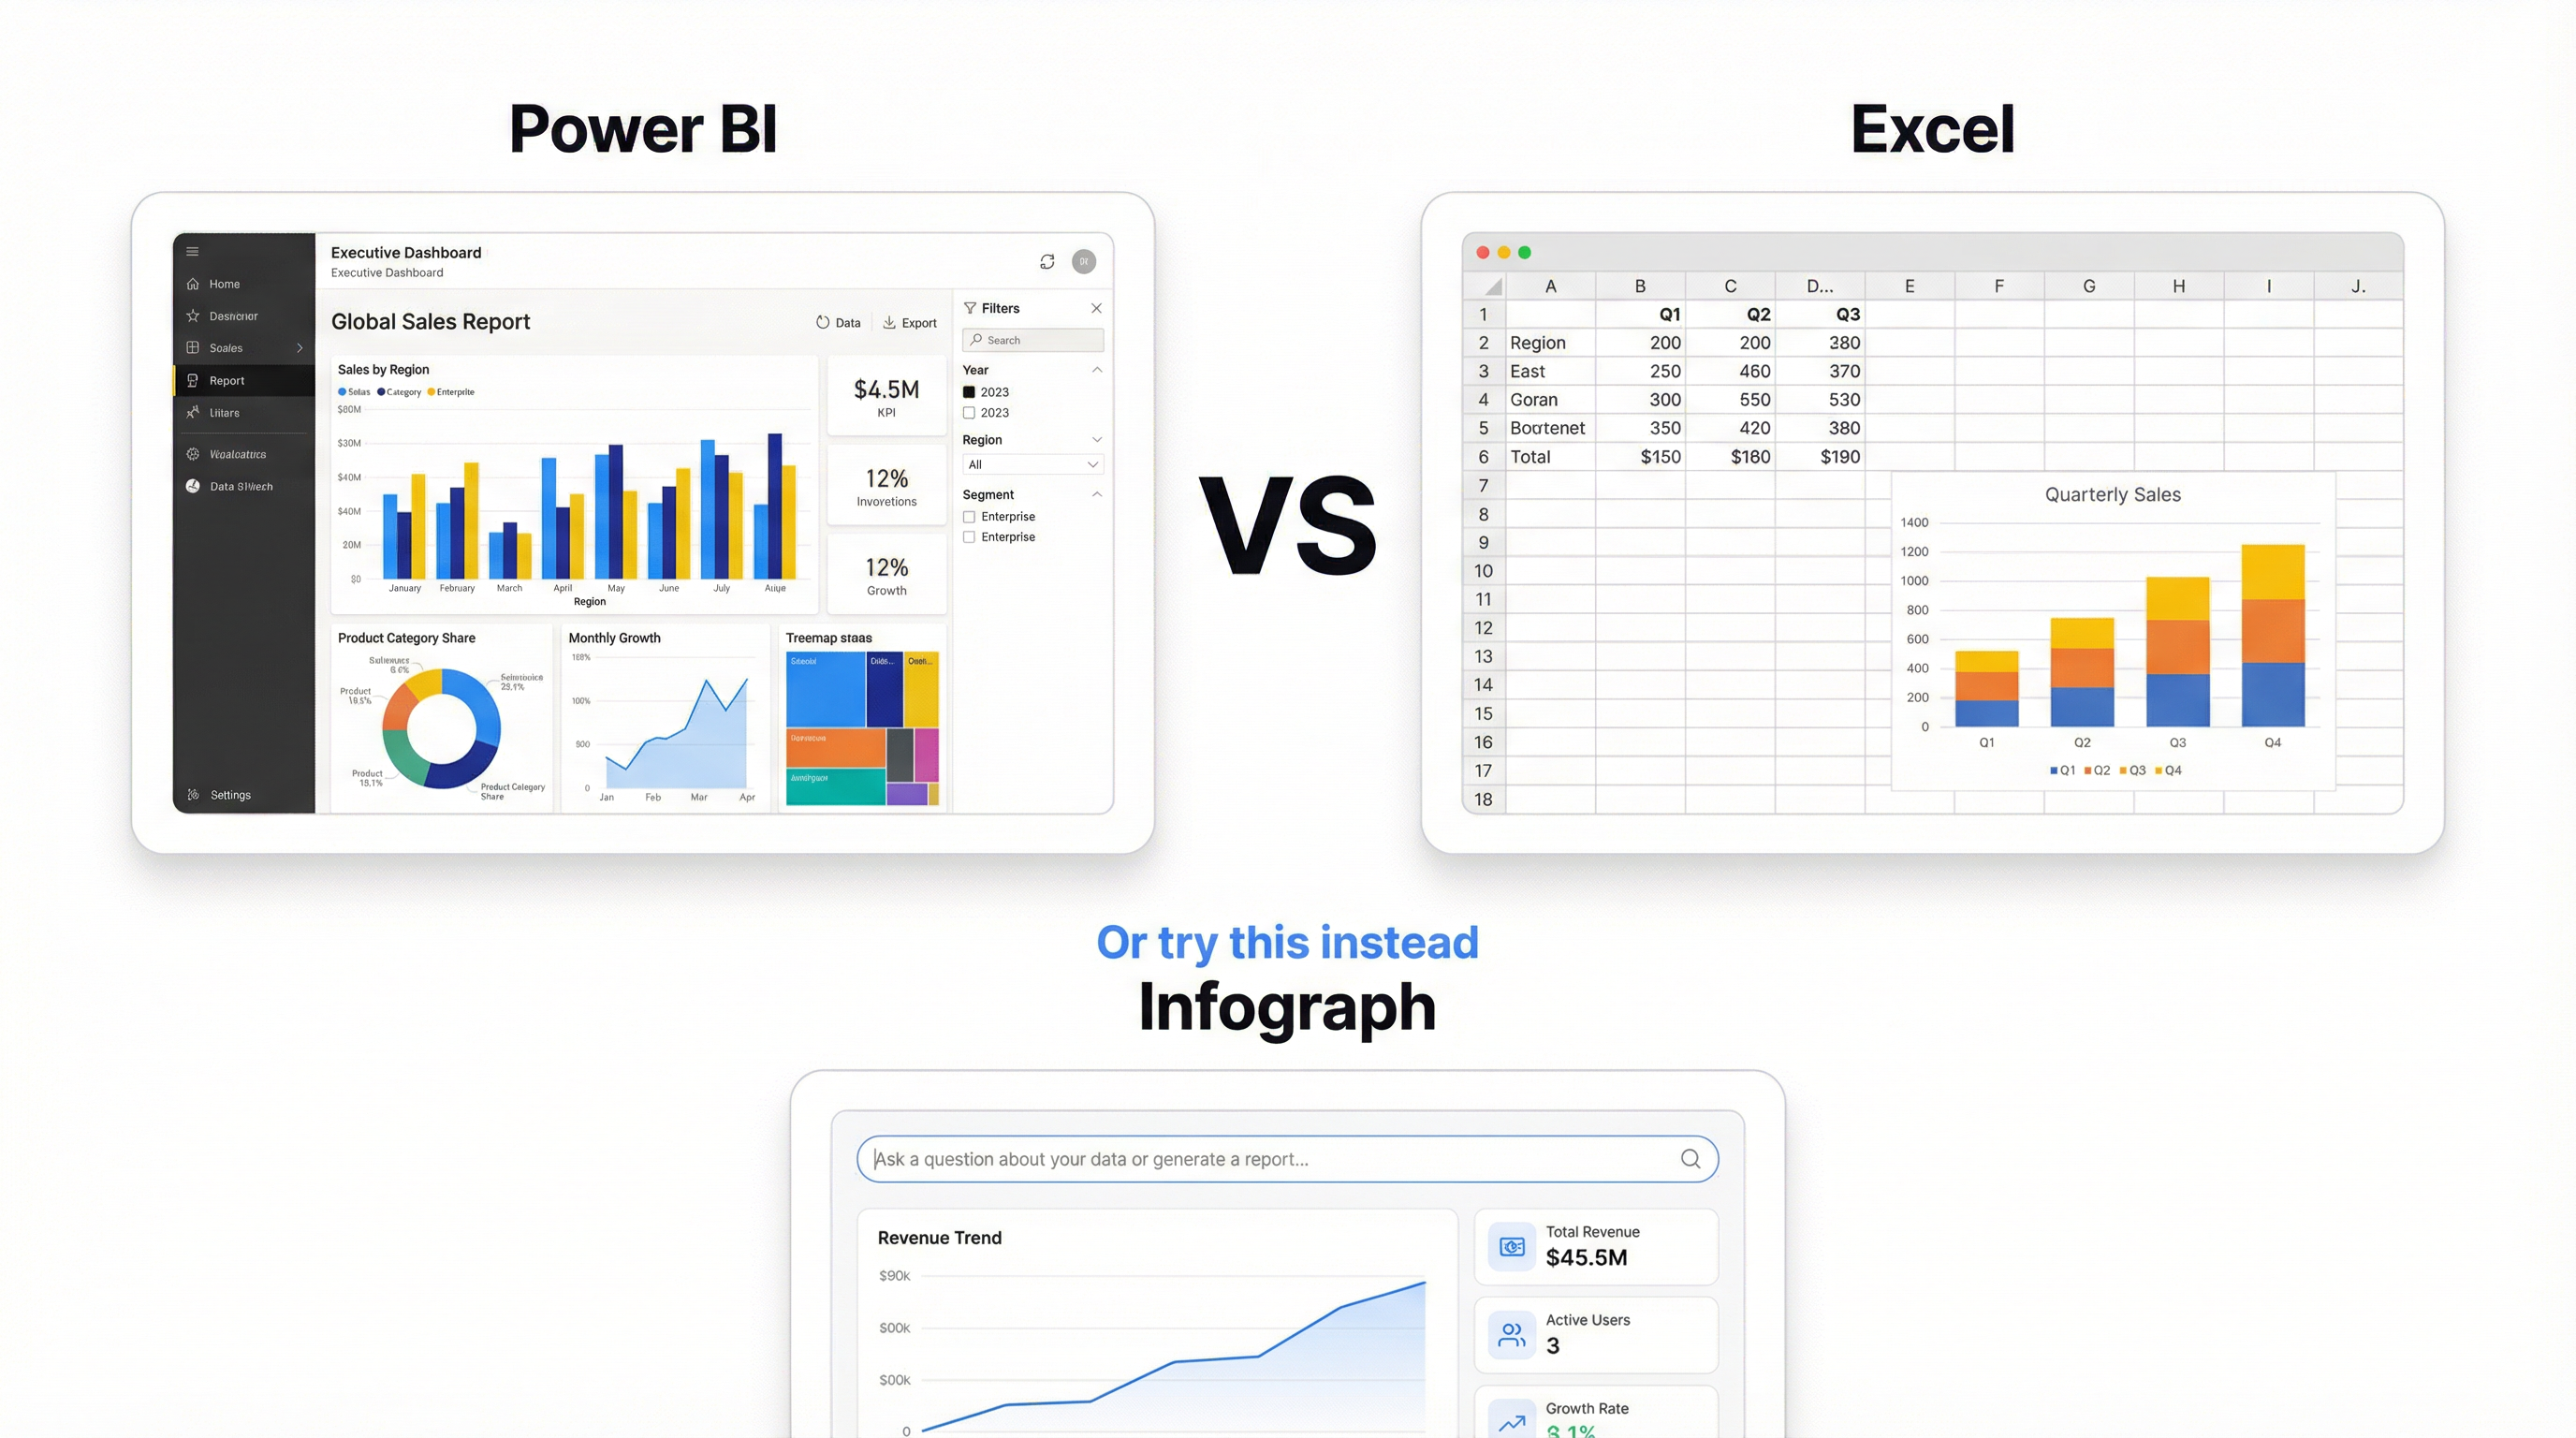
For Dashboard Purposes
When connecting to a dashboard tool like Infograph, both work equally well. The connection is direct — your dashboard pulls fresh data regardless of whether it lives in Sheets or Excel.
Our recommendation: Use whatever your team already uses. The best data source is the one your team will actually keep updated.
The Hybrid Approach
Many teams use both:
- Google Sheets for collaborative input and data collection
- Excel for heavy analysis and modeling
- Dashboards for sharing insights with stakeholders
The key is having a single source of truth for each dataset. Don’t duplicate data across platforms — that’s where things get messy.