Most performance conversations happen with incomplete information. The manager has a vague sense of how the quarter went. The employee has their own version of the story. The spreadsheet someone half-filled out before the last review cycle lives in a folder no one can find.
It doesn’t have to be this way. A good employee performance dashboard doesn’t replace judgment — it gives managers the data to apply judgment well. Here’s what you have, here’s how it’s trending, here’s where people are against their goals. The conversation happens from there.
What an Employee Performance Dashboard Should Track
Performance data varies by role, but most useful dashboards share a similar structure:
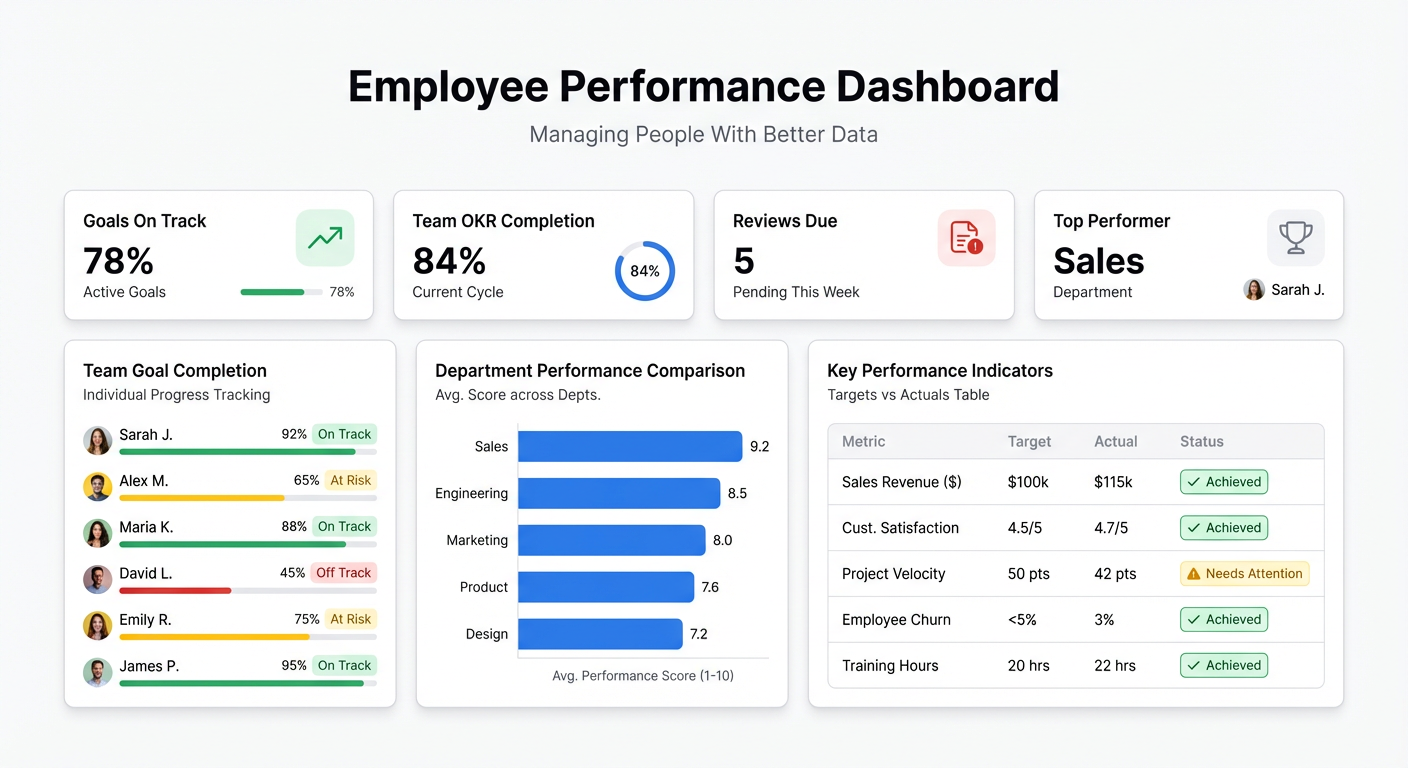
Goal progress. For each employee or team, the goals set for the period (quarter, year) and progress against them. A simple percentage-complete view is enough — the point is to see who’s on track and who isn’t without asking everyone to self-report.
Output metrics by role. Sales reps: pipeline, closed deals, revenue. Support agents: tickets resolved, response time, satisfaction score. Developers: tickets closed, deployment frequency. These numbers aren’t the full picture of performance, but they’re the objective foundation the conversation starts from.
Attendance and availability. Days present, leave taken, late arrivals if relevant. Not to micromanage — but to surface patterns. If someone’s output is declining and they’ve taken 12 sick days this quarter, that context matters.
Performance rating trends. If you run regular review cycles, tracking ratings over time shows trajectory. Is this person improving? Plateauing? The trend matters more than any single number.
Team-level aggregates. Zoom out from individual to team. What’s the average goal completion rate across the department? Are there outliers in either direction who need attention?
Time to complete milestones. For project-based roles, how long does it actually take to deliver against expected timelines? Consistently late delivery is a signal — as is consistently early delivery that might mean targets are set too low.
What a Performance Dashboard Is Not
A few things to be clear about before building:
It’s not a surveillance tool. Tracking every mouse click or monitoring login times destroys trust faster than any productivity gain is worth. The metrics on this dashboard should be output-focused, not activity-focused.
It’s not a replacement for manager judgment. Data shows what happened. It doesn’t show why, or what it means, or what to do about it. A manager who replaces judgment with metrics misses the human context that makes the data meaningful.
It’s not a source of truth about someone’s value. A strong employee might have a bad quarter. An average employee might have a great one. The dashboard is one input among many — not the verdict.
Where Employee Performance Data Lives
HR teams typically have data scattered across:
- HRIS (BambooHR, Workday, Rippling) — employment records, leave, basic attendance
- Goal tracking (spreadsheets, Lattice, 15Five) — OKRs, individual goals, review scores
- Role-specific tools — CRMs for sales data, ticketing systems for support, project management tools for delivery metrics
- Survey tools — engagement scores, 360 feedback aggregates
The challenge isn’t that the data doesn’t exist — it’s that it’s fragmented. Pulling it into a single view requires someone to manually compile it before every review cycle, which means the data is always at least slightly stale.
The fastest path to a working dashboard: consolidate key metrics into a Google Sheet (or get exports from each tool into a single spreadsheet), then connect that to Infograph.
Building Your Employee Performance Dashboard with Infograph
Step 1: Define the Metrics That Matter for Each Role
Before building, decide what you’re tracking. For each role type in your team, list 3-5 output metrics. Sales: pipeline created, deals closed, quota attainment. Support: tickets resolved per day, average response time, CSAT. Managers: team goal completion rate, headcount retention.
Fewer, better metrics beat comprehensive data that no one reads.
Step 2: Consolidate Into a Google Sheet
Create a sheet with one row per employee per period. Include: employee name, role, department, period (month/quarter), each relevant metric, overall goal completion %, and any qualitative rating if you run review cycles.
This sheet becomes the source of truth the dashboard draws from. Keep it updated — weekly for active metrics, monthly for review data.
Step 3: Connect to Infograph
Connect the Google Sheet directly to Infograph. As you add new periods or update metrics, the dashboard updates automatically.
Step 4: Describe Your Dashboard
Type what you want:
“Show goal completion percentage for each employee as a bar chart, grouped by department. Add a table showing each employee’s key metrics for the current quarter. Create a team-level summary showing average goal attainment by department. Highlight anyone below 70% goal completion in red.”
Infograph builds from your column headers. Describe the view you want and it assembles the charts.
Step 5: Build Role-Specific Views
For larger teams, separate views by role type are more useful than one combined dashboard. “Add a tab for the sales team showing pipeline, closed deals, and quota attainment. Add a separate tab for the support team showing tickets resolved and CSAT by agent.”
Different roles need different metrics front and center.
Step 6: Share Thoughtfully
Who sees this dashboard matters. Options:
- Manager-only view: Full team data visible to managers and HR, not shared with individuals
- Individual view: Each employee sees only their own metrics
- Team aggregate view: Team-level averages shared with the whole team, individual data stays private
Infograph’s sharing controls let you publish the same dashboard to different audiences with different access levels on Teams plan.
Using the Dashboard in Performance Conversations
The dashboard is most useful when it becomes part of a recurring rhythm rather than a one-time review artifact.
Weekly check-ins. 15 minutes, manager and report. Pull up the dashboard. Are the metrics moving in the right direction? Is anything flagged? The conversation focuses on what’s happening, not on recalling what happened.
Monthly review. Zoom out. How did the whole month look? Is goal progress on track for the quarter? Where do we need to adjust the plan?
Quarterly reviews. The dashboard is context, not verdict. Review the full quarter’s metrics alongside qualitative feedback. The numbers show what happened — the conversation is about why and what comes next.
When performance data is consistently visible, there are no surprises at review time. Both the manager and the employee have seen the same numbers all quarter. The conversation starts from a shared understanding of the facts.
Common Additions That Add Significant Value
Once the core dashboard is running:
- Peer comparison — where does each person sit relative to team average? Useful context without being punitive
- Trend lines — is performance improving quarter-over-quarter? Trajectory matters as much as absolute level
- Milestone tracking — for development goals (certifications, skill development), simple checkboxes that show progress
- Engagement score overlay — if you run quarterly engagement surveys, correlating engagement with output metrics shows whether low scores predict performance changes
Start Free
Build your first employee performance dashboard on Infograph’s free plan — no credit card required. Upload your team data, describe the view you want, and have something ready for the next review cycle in minutes.
Teams plan adds multi-seat collaboration and secure sharing controls — the right fit when managers and HR need different access to the same underlying data.


