Your ATS knows exactly how many candidates are at each stage. Your spreadsheet tracker knows which roles have headcount approval. Your finance team has the budget numbers. None of them talk to each other — and every Monday standup turns into someone screen-sharing three different tabs trying to piece together what’s actually happening with hiring.
That’s the real problem with recruitment reporting. The data exists. It’s just scattered across systems that weren’t designed for cross-functional visibility.
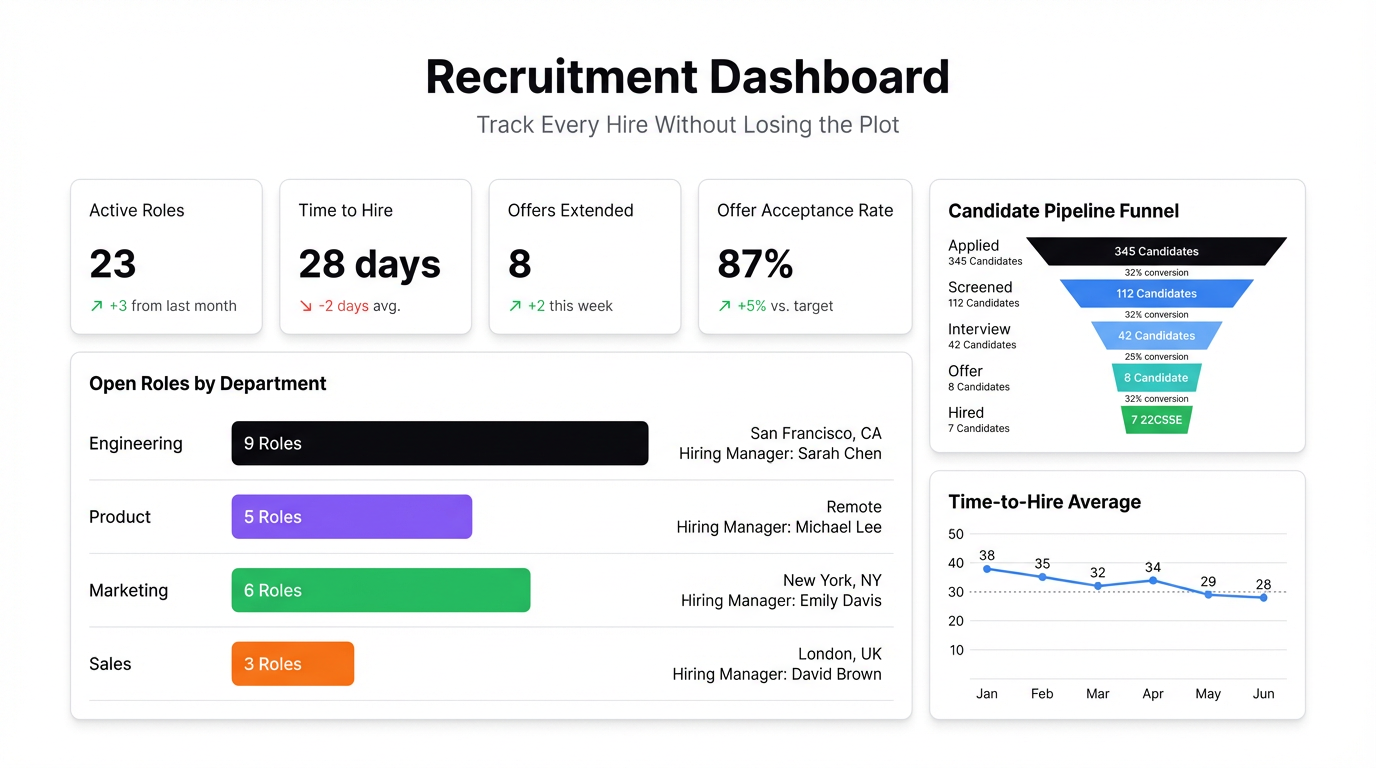
A good recruitment dashboard fixes this. Not by replacing your ATS, but by pulling the numbers that matter into one place that HR, hiring managers, and leadership can all look at without needing a login or a tutorial.
What a Recruitment Dashboard Should Actually Track
There’s no shortage of metrics you could track. Here’s what actually matters:
Time to hire — The number of days from a role going live to an offer being accepted. This one metric tells you whether your process is functional. If it’s creeping past 45 days for mid-level roles, something is broken upstream.
Pipeline by stage — How many candidates are at each stage across all open roles right now. Applications → Phone screen → Interview → Final round → Offer. This shows you where candidates are stalling. If you’ve got 40 people at the phone screen stage and 3 at final round, your interviewers are the bottleneck.
Source quality — Where are hired candidates actually coming from? LinkedIn, Indeed, referrals, direct applications? Most teams track source volume (where applications come from) but not source quality (where hires come from). These are very different numbers.
Offer acceptance rate — The percentage of offers extended that are accepted. Below 80% and you have a compensation or process problem. Track this by role type and hiring manager, not just company-wide.
Cost per hire — Total recruiting spend (job ads, agency fees, recruiter time) divided by number of hires. This one usually lives in a spreadsheet that gets updated quarterly, if ever. It should be monthly.
Why Your ATS Isn’t Enough
Every ATS — Greenhouse, Lever, Workday, BambooHR — has a reporting module. And every ATS reporting module is designed for recruiters, not for the hiring manager who needs to know where their headcount is, or the VP who wants to know if they’re on track to hit their Q2 growth plan.
The core issue is access. ATS reports require a login, and most hiring managers don’t have one. Even when they do, they’re not going to dig through filter menus to get a status update on their open roles. They want to see a dashboard, not run a report.
The other issue is coverage. Your ATS doesn’t know about roles that are approved but not yet opened. It doesn’t know your budget. It doesn’t know that two of your open roles have been on hold because the hiring manager is on leave. Context lives in spreadsheets and emails, not in your ATS.
Getting Your Data Into Infograph
You have two paths here depending on how your team works.
Option 1: Export from your ATS as CSV
Every ATS has a data export. Pull a report with columns for: role title, department, stage, candidate name, application date, source, hire date, and recruiter. Download it as a CSV. You can upload this directly to Infograph.
The limitation is that it’s a point-in-time snapshot — it won’t update automatically unless you re-upload. Fine for a weekly review, not ideal for a live view.
Option 2: Connect a Google Sheet tracker
If your team already maintains a hiring tracker in Google Sheets (most do, even if they also use an ATS), this is the better option. Connect your Google account to Infograph, add your hiring tracker sheet as a data source, and your dashboard will update automatically whenever the sheet changes.
This is the setup that actually gets used. Recruiters update the sheet; the dashboard reflects it. No manual exports, no stale data.
To connect a Google Sheet in Infograph: go to Data Sources → Add Connection → Google Sheets, authorize your Google account, and select the sheet. That’s it.
Building the Dashboard
Once your data is connected, describe what you want in plain English. Something like:
“Show me a bar chart of open roles by department, a funnel of candidates by pipeline stage, time to hire as a KPI card, and a table of roles sorted by days open.”
Infograph builds it. You can adjust the layout, swap chart types, and add additional visuals from there. The whole thing takes a few minutes, not a few hours.
For a recruitment dashboard specifically, the layouts that tend to work:
- Top row: KPI cards for time to hire, offer acceptance rate, total open roles, and cost per hire
- Middle row: Pipeline funnel (candidates by stage) and a bar chart of source quality
- Bottom: A table of all open roles with stage, days open, and recruiter
Sharing It With the People Who Need It
Once your dashboard is built, hit Publish. You can share it as a private link restricted to your team, or make it accessible to specific people within your organization.
For hiring managers: send them the dashboard link. They can see exactly where their roles stand without ever opening the ATS.
For leadership headcount reviews: the dashboard is the presentation. Pull it up in the meeting instead of a slide deck. Numbers are live, questions get answered in real time.
This is what changes the dynamic. When the data is visible and current, the conversation shifts from “what’s the status?” to “what do we do about it?”
If you’re managing hiring across multiple roles and want a live view that your whole team can see, build your recruitment dashboard in Infograph — connect your Google Sheet or upload a CSV and describe what you want to see.


