Power BI does a lot. It connects to hundreds of data sources, has a full DAX formula language, supports enterprise-scale data models, and integrates tightly with the Microsoft 365 stack. If you’re a data analyst at a large organization who needs all of that, it’s a serious tool.
But a lot of people who end up with Power BI licenses don’t need most of it. They need to turn a spreadsheet into a dashboard that their team can look at. They need to track a handful of metrics, share the result with stakeholders, and update it when the data changes.
For that use case, Power BI is overkill in ways that actively hurt you.
The Real Problems With Power BI
The learning curve is steeper than it looks. Power Query for data transformation. DAX for calculated columns and measures. The data model layer. Report vs. Dashboard distinction (they’re different things in Power BI, confusingly). Premium vs. Pro licensing for sharing. Desktop app vs. service. Most people who start a Power BI project spend their first two weeks on setup and data prep before they build a single chart.
The pricing structure makes sense for enterprises and no one else. Power BI Pro is $10/user/month, but you need it for every person who wants to view a shared report — not just build one. Want to share with 20 stakeholders? That’s $200/month just for licensing. Power BI Premium per user is $20/month and unlocks more features, but it’s still per-seat pricing for your entire audience.
The desktop app is a real friction point for small teams. Power BI Desktop (Windows only — still, in 2026) is where most of the actual work happens. If you’re on a Mac, you’re running it in Parallels or you’re using the browser-based experience, which is limited. Teams that are half-Mac get a half-Power BI experience.
None of this is a reason to never use Power BI. But if you’re evaluating it for the first time and your use case is “I want dashboards from my data”, these are real costs you’ll pay.
What the Alternatives Actually Are
There’s no shortage of Power BI alternatives, but they’re not all solving the same problem.
Tableau — more powerful than Power BI in some ways, more expensive, similar learning curve. Same “you need an analyst to really use this” limitation. The per-user pricing ($75/month for Creator, $15 for Explorer, $15 for Viewer on the cloud version) is actually worse than Power BI for most small teams.
Looker — enterprise BI with a steep implementation cost. You’ll need a data engineer and probably a consultant to set it up. Not an alternative in any practical sense unless you have serious data infrastructure.
Metabase — open source, self-hosted option. Free to run on your own infrastructure, $500/month for the cloud version. Good SQL editor, decent charts, but still requires someone with database access to set it up. Better than Power BI for technical teams, not simpler.
Google Looker Studio — free, integrates well with Google Analytics and Google Sheets, genuinely easy to get started with. The charts are limited and it can feel shallow quickly, but for simple dashboards from Google data, it’s hard to beat on price.
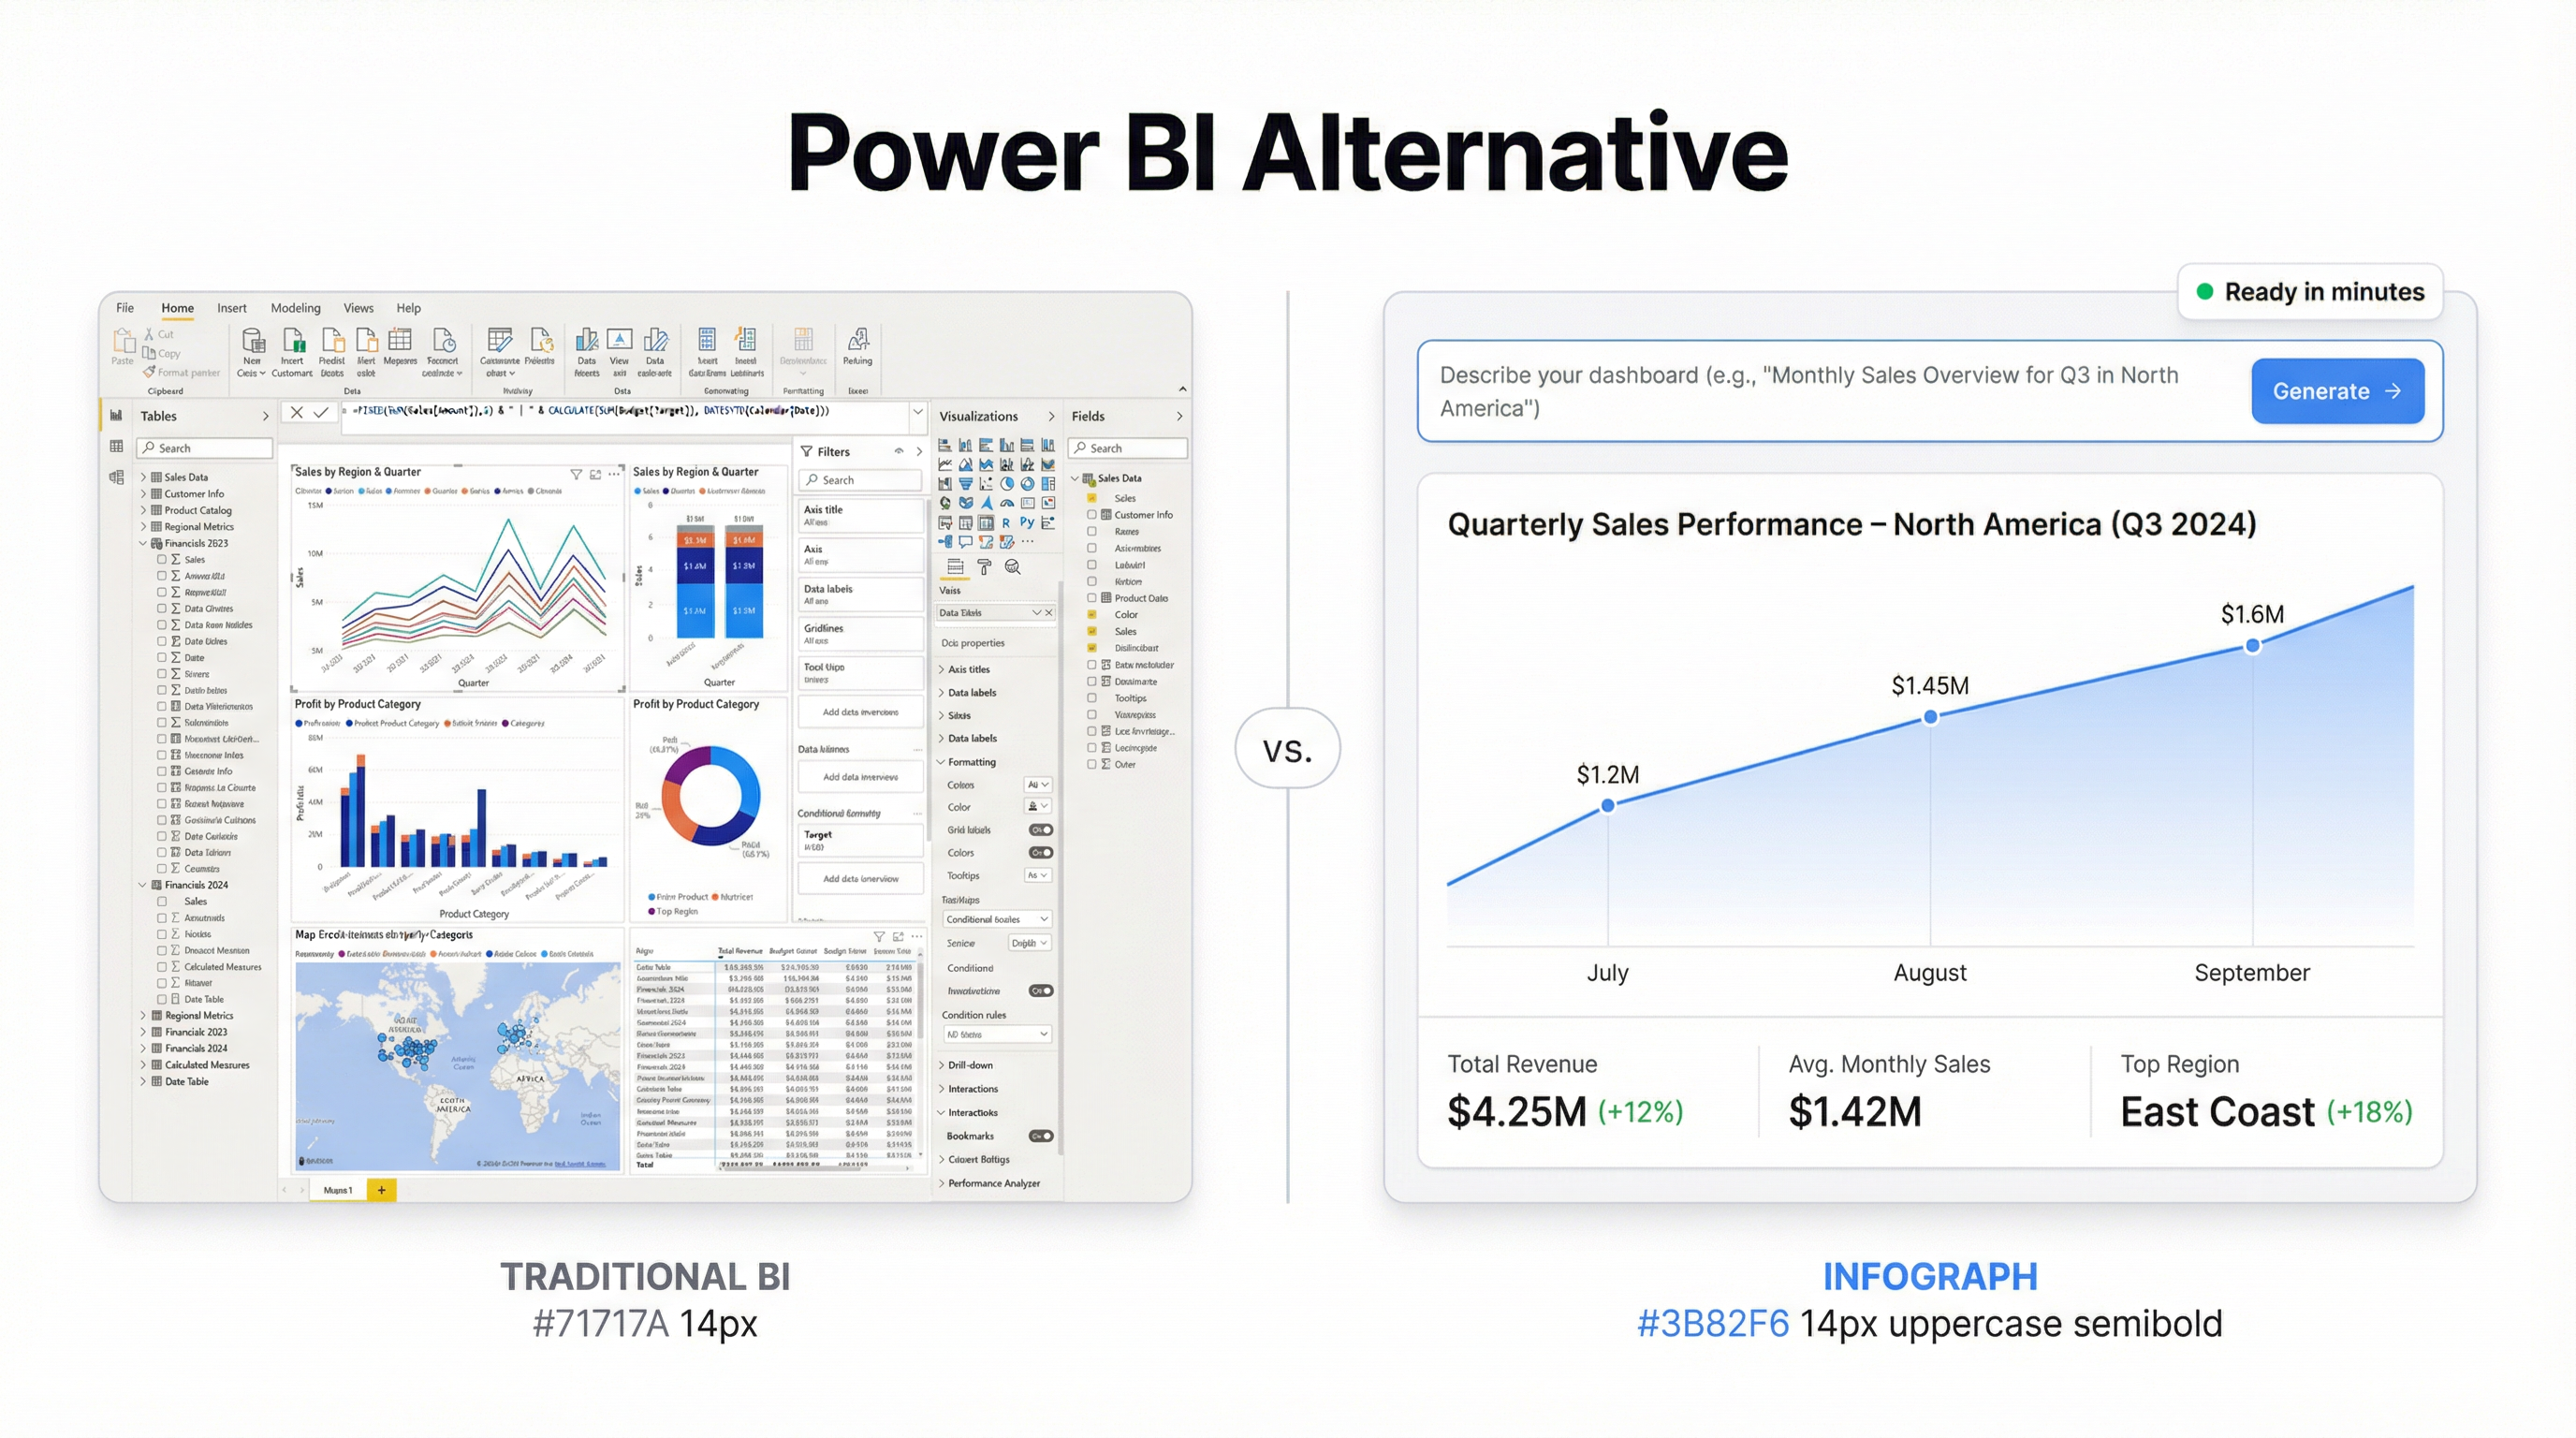
Infograph — built for the use case Power BI is overkill for: turn a file or spreadsheet into a dashboard without writing formulas or configuring data models. Connect a CSV, Excel file, Google Sheet, or Excel Online document, describe what you want, and the AI builds it. Free for one dashboard, $19.99/month for Pro.
Side-by-Side on the Things That Actually Matter
Setup time to first dashboard:
- Power BI: 1–4 hours minimum (install desktop app, connect data, learn the interface, build visuals)
- Tableau: Similar or longer
- Looker Studio: 30–60 minutes for simple Google data sources
- Metabase: 2+ hours if self-hosting, less for cloud
- Infograph: Under 10 minutes from data upload to working dashboard
Works on Mac:
- Power BI: Partially — desktop app is Windows-only
- Tableau: Yes
- Looker Studio: Yes (browser-based)
- Metabase: Yes
- Infograph: Yes
Cost for a team of 5 with 10 stakeholders viewing dashboards:
- Power BI: $50–$200/month depending on plan (Pro for everyone who views)
- Tableau: $225–$750/month
- Looker Studio: Free
- Metabase: Free (self-hosted) or $500/month (cloud)
- Infograph: $49.99/month (Teams plan covers 3 builders, all stakeholders can view shared links)
Can a non-analyst use it independently:
- Power BI: Rarely without training
- Tableau: No
- Looker Studio: Mostly, with limitations
- Metabase: With help from a technical person to connect data
- Infograph: Yes — it’s designed specifically for this
AI-generated dashboards from natural language:
- Power BI: Limited (Copilot in M365, additional cost)
- Tableau: Limited (Tableau Pulse, enterprise)
- Looker Studio: No
- Metabase: No
- Infograph: Core feature
When Power BI Is Still the Right Choice
If your organization is already deep in Microsoft 365 and your data lives in Azure, SQL Server, or SharePoint — Power BI makes sense. The integrations are native, licensing may already be bundled, and your IT team can support it.
If you have a data team and you need complex data models, multi-source joins, or row-level security for sensitive business data — Power BI handles those things properly.
If you need certified metrics that are consistent across the organization (every team’s “revenue” number means the same thing) — Power BI’s semantic layer is genuinely useful.
None of those requirements describe most small business users, startup teams, or department managers who just want to understand their data.
When to Switch
You don’t need Power BI to understand your data. You need a dashboard.
If you’ve spent more time configuring Power BI than looking at insights, that’s the signal. If your team is sharing screenshots of reports because sharing the actual report requires everyone to have a license, that’s the signal. If you’re still building the first version of a dashboard you needed last month, that’s the signal.
The tools that have taken Power BI’s use cases from the bottom are doing it by removing the requirement for a trained analyst between the data and the answer. You shouldn’t need to know DAX to see your sales numbers. You shouldn’t need to install a Windows application to share a chart with your board.
Upload your data to Infograph. Type what you want to see. Share the link.


