Your call center platform probably shows you call volume and total tickets closed. Maybe agent handle time if you dig around. What it almost certainly doesn’t show you is whether your team is actually solving problems — or just processing them.
That’s the gap a good call center dashboard fills. Not more numbers — the right numbers, together, in a view your team leads and managers can actually act on.
The Metrics That Matter
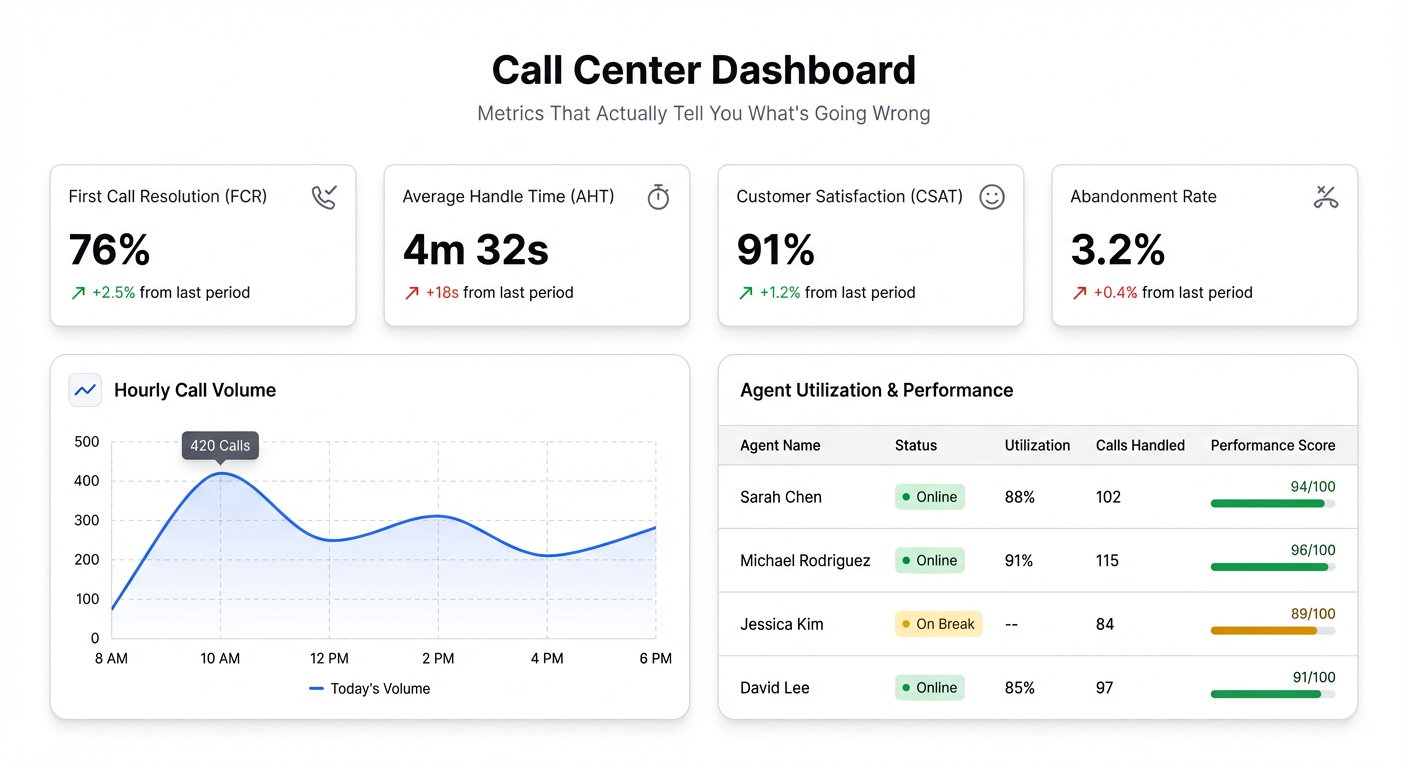
First Contact Resolution (FCR) is the single most important metric in customer service. If a customer has to call back about the same issue, everything else is noise. A 70% FCR means 30% of your customers are suffering twice. FCR tells you whether your agents have the knowledge, tools, and authority to actually solve problems — not just log them.
Average Handle Time (AHT) gets misused constantly. Managers chase low AHT as if speed equals efficiency. It doesn’t. An agent who closes a ticket in 3 minutes but generates a callback has a worse FCR than one who takes 8 minutes and actually resolves it. AHT is useful as a baseline and for spotting outliers — agents who are dramatically slower or faster than peers — not as a target to minimize.
Customer Satisfaction Score (CSAT) is imperfect but necessary. Post-contact surveys have low response rates and skew negative. You know this. Track it anyway. Combined with FCR, it tells you whether customers felt helped even when the issue was resolved. Sometimes the process is fine; the experience isn’t.
Abandonment Rate is your queue health signal. When customers hang up before reaching an agent, you don’t just lose a ticket — you lose trust. A spike in abandonment usually means one of three things: unusual volume, insufficient staffing, or a routing problem. Your dashboard should show abandonment alongside queue wait time so you can tell which it is.
Queue Wait Time belongs next to abandonment for exactly that reason. Looking at either in isolation misleads you. High wait time with low abandonment might mean customers are patient and the issue is urgent. High abandonment with moderate wait time might mean expectations are off. The combination is what’s diagnostic.
Agent Utilization is the capacity metric. It tells you what percentage of logged-in time agents are actively handling contacts. Below 70% and you’re probably overstaffed or have routing inefficiencies. Above 85% consistently and agents will burn out and quality will drop. The goal is a healthy range, not maximum occupancy.
What to Stop Tracking (Or at Least Stop Prioritizing)
Total calls handled is a volume number, not a performance number. It tells you how busy you were, not how well you did. The same goes for tickets closed per day as a primary metric — it incentivizes speed over resolution, which kills FCR.
Average speed to answer without pairing it to abandonment and CSAT is similarly misleading. You can hit great speed-to-answer numbers by having agents rush through calls. That’s not a win.
Getting Your Data Out
Most call center and support platforms export cleanly. From Zendesk, go to Reports → Insights or use the Explore module to export ticket data as CSV. From Freshdesk, the Reports section lets you export agent performance and ticket summaries directly. Intercom has a Reports tab with conversation and resolution data you can export.
If your team is already tracking performance in a Google Sheet — pulling data manually from these platforms, logging daily numbers, whatever — that works too and is often simpler to start with.
The exports typically include ticket/call ID, agent name, created time, resolution time, CSAT score, and contact channel. That’s enough to calculate FCR (tickets with follow-up contacts), AHT, and abandonment if your platform tracks it.
Building the Dashboard in Infograph
Connect your data source — either upload the CSV export directly or link a Google Sheet if you’re maintaining a running log. Then describe what you want:
“Build a customer service dashboard showing first contact resolution rate, average handle time by agent, CSAT score trend over the past 30 days, and abandonment rate by hour of day.”
Infograph generates the dashboard. You can then adjust — add a filter by team or channel, change the date range, reorder the cards. The whole thing takes a few minutes from “I have a CSV” to “I have a dashboard.”
If you’re using a Google Sheet that gets updated regularly — whether your team adds to it manually or you’ve set up an export that refreshes — connect it as a live data source. The dashboard updates automatically as new rows come in. No re-uploading, no rebuilding.
Sharing It
Once the dashboard looks right, publish it. You can share it with team leads privately (restricted to your account’s team members), or generate a password-protected link for stakeholders who don’t have Infograph accounts. For management reviews, a snapshot link works well — it captures the dashboard state at a specific point in time, useful for weekly or monthly reporting.
The difference between a dashboard that gets used and one that doesn’t is usually access. If your team lead has to log in somewhere, find the report, and export it every Monday morning — they won’t. A shared link they can bookmark is one fewer reason to skip the review.
If your call center data is sitting in a spreadsheet or a CSV export and you’re still reading metrics one column at a time, build your dashboard in Infograph. Connect your data, describe what you want to see, and have a working customer service dashboard in minutes.


