Google Analytics gives you everything. That’s the problem.
Sessions, users, pageviews, bounce rate, engagement rate, average session duration, events, conversions, traffic channels, landing pages, exit pages, device breakdown, geo data, real-time users — it’s all there. And because it’s all there, most people open GA4, feel overwhelmed, and close the tab having learned nothing useful.
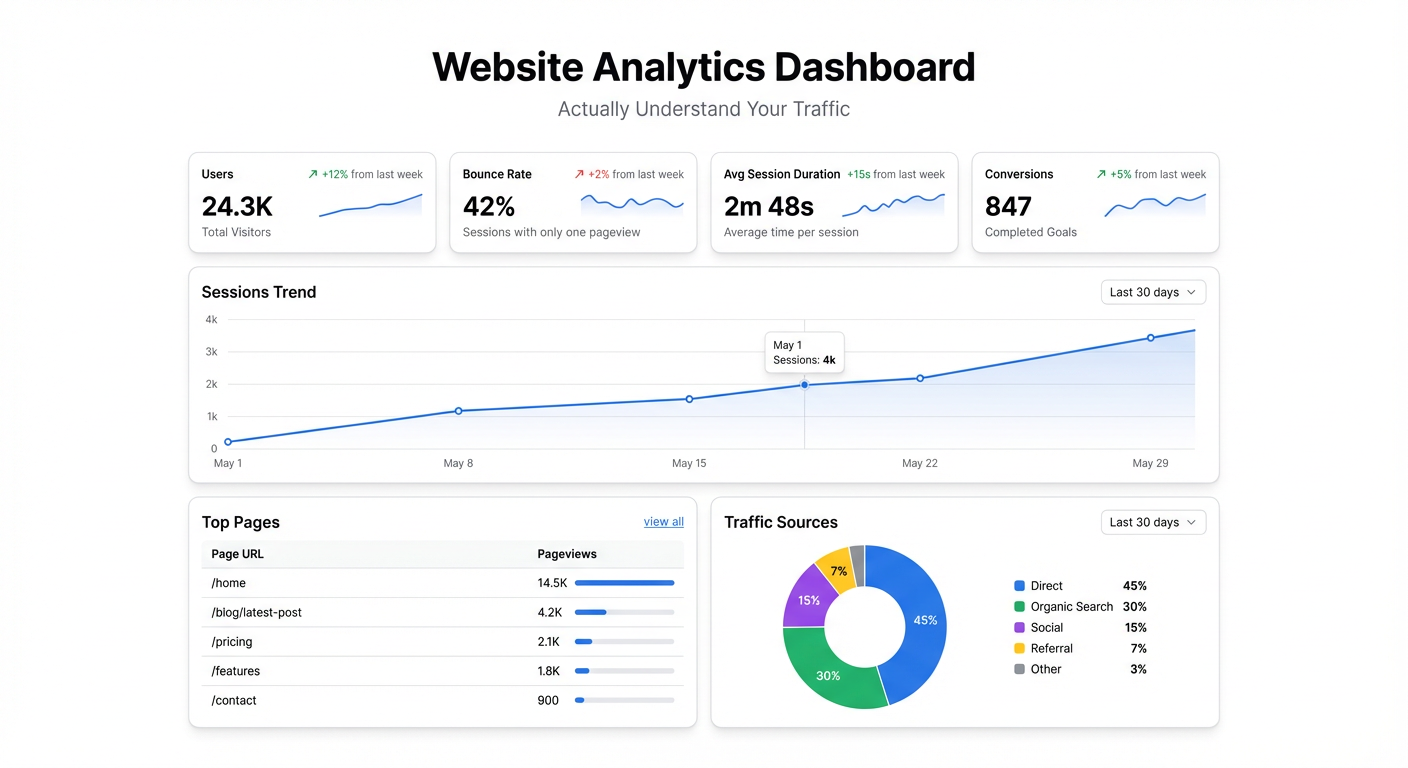
A website analytics dashboard is a different thing. It’s not GA4 with extra steps — it’s a curated view of the 8-10 metrics that actually tell you whether your site is working. Built once, checked daily, updated automatically. No digging, no exporting, no interpretation required.
What a Website Analytics Dashboard Should Track
The goal is triage: at a glance, what’s working, what’s not, what needs attention. Here’s what belongs on the dashboard:
Total visitors (unique users). The headline. Is traffic growing, flat, or declining? Week-over-week and month-over-month trends matter more than the absolute number.
Traffic by channel. Where are visitors coming from? Organic search, direct, referral, paid, social, email — broken down with trend lines. If organic traffic is flat but paid is up, you know what’s driving growth. If social drops suddenly, you know where to investigate.
Top landing pages. Which pages are people actually arriving on? Your homepage isn’t necessarily the most important entry point. Blog posts, product pages, and landing pages often drive more first visits. This shows you which content is pulling weight.
Bounce rate / engagement rate. Are people sticking around or bouncing immediately? In GA4 terms: engagement rate (percentage of sessions with meaningful interaction) is the better metric. Low engagement on a high-traffic page is a signal the page isn’t delivering what people expected.
Conversion rate. Signups, demo requests, purchases — whatever your primary conversion event is. What percentage of visitors are taking the action you want? This is the metric that connects traffic to business outcomes.
Top converting pages. Which pages produce the most conversions? Often surprising. Frequently a blog post or comparison page outperforms the homepage. Knowing which pages convert best tells you where to send more traffic.
Time on site / pages per session. Engagement depth. Are people reading one page and leaving, or exploring? Trend over time shows whether content quality is improving.
New vs. returning visitors. New visitors measure acquisition. Returning visitors measure retention and brand strength. A site that only gets new visitors has no loyalty. A site that only gets returning visitors isn’t growing reach.
The Difference Between Reporting and Analysis
Most people use website analytics for reporting: pull the numbers, note whether they’re up or down, move on. That’s better than nothing, but it’s not analysis.
Analysis asks why. Traffic dropped 15% this week — which channel dropped? Which pages? What changed? A good dashboard makes these questions answerable in seconds rather than minutes, because the breakdowns are already there.
Build the dashboard for analysis, not just reporting. That means including the breakdowns (by channel, by page, by segment) alongside the headline numbers.
Building Your Website Analytics Dashboard with Infograph
Step 1: Export Your Core GA4 Data
Pull your key metrics from Google Analytics 4 into a Google Sheet. GA4’s built-in data exports let you schedule regular reports — set up a weekly or daily export for:
- Sessions, users, and pageviews by date
- Traffic by channel by date
- Landing page performance (sessions, engagement rate, conversions)
- Conversion events by date
These four exports give you everything you need for a comprehensive dashboard.
If you use a third-party analytics tool (Plausible, Fathom, PostHog) — the same approach works. Most tools support CSV export or Google Sheets integration.
Step 2: Connect to Infograph
Connect the Google Sheet to Infograph. Live connection means as your weekly GA4 exports land in the sheet, the dashboard updates automatically. No manual refreshing, no re-uploading.
Step 3: Describe Your Dashboard
Type what you want:
“Show total unique visitors as a line chart over the last 90 days with a 7-day rolling average. Add a stacked bar chart showing traffic by channel each week. Create a table of top 10 landing pages ranked by sessions, with engagement rate and conversion rate columns. Add cards for total sessions this month, conversion rate, and month-over-month growth.”
Infograph reads your exported column names and builds the charts. You’re describing the view, not configuring it.
Step 4: Add the Competitive Context
Raw numbers are more useful with benchmarks:
“Add a week-over-week percentage change indicator next to each card. Add a line showing last year’s traffic on the same chart as this year.”
Year-over-year and week-over-week comparisons turn isolated numbers into meaningful signals.
Step 5: Build Focused Sub-Views
Once the main dashboard is running, channel-specific views often add significant value:
SEO view: organic traffic by page, keyword-driven traffic trends, pages gaining and losing search visibility. If you’re publishing content to drive organic growth, this is the view you check weekly.
Content performance view: blog posts ranked by traffic, engagement rate, and conversions. Shows which content drives real value versus which posts get read and immediately forgotten.
Conversion funnel view: traffic → engagement → conversion, broken down by channel. Shows where you’re losing people and which acquisition channels produce the highest-quality visitors.
Prompt Infograph to add these as separate sections or dashboards as you need them.
Step 6: Share with the Team
Publish the dashboard. Share it with your marketing team, your content writers, your founders. When traffic data is visible to everyone, content and marketing decisions happen with better information.
For teams where everyone should see performance but not everyone needs to edit: publish the dashboard with view-only access on a stable URL that the team bookmarks.
The Weekly Ritual That Actually Works
The most successful teams treat the website analytics dashboard as a weekly ritual, not a monthly chore.
Every Monday morning: open the dashboard, check last week’s numbers. Traffic up or down week-over-week? Which channels moved? Any pages that spiked or dropped? What’s the conversion rate doing?
The review takes five minutes when the data is already organized. It surfaces the signal from the noise before you plan the week’s work. By the time your team is deciding what content to write or where to put ad budget, you’re making those decisions with data from seven days ago rather than thirty.
That time compression — from monthly to weekly — is where analytics starts to actually drive decisions.
What the Dashboard Won’t Tell You
Worth being honest: even a great website analytics dashboard has limits.
It shows you what happened, not why. Traffic dropped — but why? Algorithm update? Bad week for social? A competitor launched something? The dashboard is the starting point for investigation, not the answer.
It shows aggregate behavior, not individual intent. You see that the pricing page has a high exit rate — but you don’t know whether people are leaving because the price is too high, the page is confusing, or they got what they needed and left to sign up. Session recordings and user surveys fill that gap.
Use the dashboard to identify what to investigate. Then investigate.
Start Free
Build your first website analytics dashboard on Infograph’s free plan — no credit card required. Export your GA4 data to a Google Sheet, describe the dashboard you want, and have a working view in minutes.
Pro plan adds live Google Sheets connections — so your dashboard updates automatically as new data arrives, without manual exports.


