You know the feeling. A customer places an order, you check the spreadsheet, and the number is wrong. Someone updated stock last Tuesday but forgot to log a shipment. Now you’re either turning away a sale or shipping product you don’t have.
Inventory managed in spreadsheets is inventory managed badly. Not because spreadsheets are bad tools — they’re not. But because stock levels are live data, and spreadsheets are static files. The moment you close the tab, the data starts going stale.
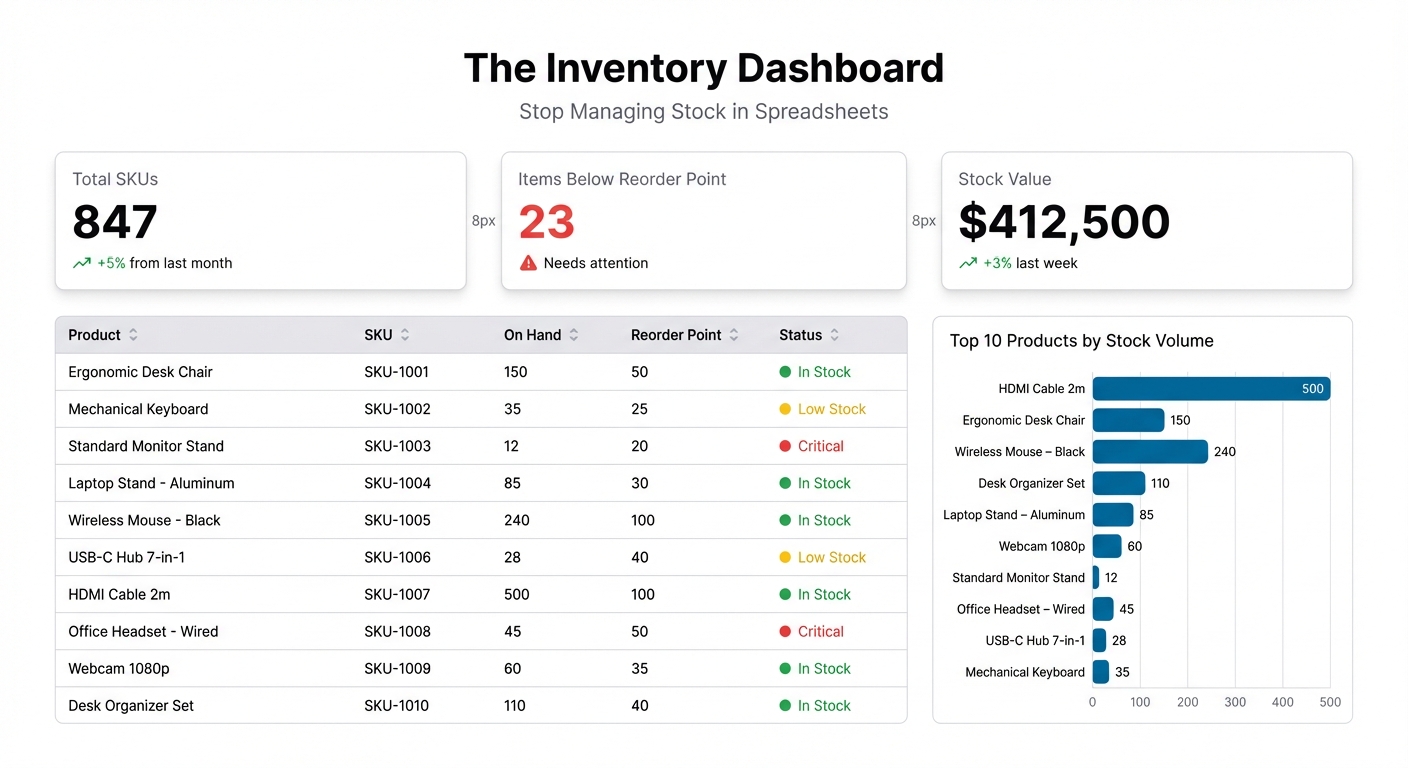
An inventory dashboard fixes this. One view of everything that matters — what you have, what’s running low, what’s on order, and where your suppliers are letting you down — updated in real time from the data you’re already tracking.
What an Inventory Dashboard Should Show
Most inventory dashboards try to do too much. You don’t need 30 charts. You need the numbers that prevent stockouts and overbuying. Here’s what actually matters:
Current stock levels by SKU. The core. At a glance: what you have on hand for each product. Color-coded so items below the reorder threshold stand out immediately. Green means fine. Yellow means order soon. Red means order now.
Days of stock remaining. Stock level alone is meaningless without velocity. 50 units sounds comfortable until you realize you’re selling 25 a day. Days of stock remaining — calculated from current level and recent sales rate — tells you how long you have before a stockout.
Reorder alerts. A dedicated panel for SKUs that have crossed the reorder point. This should be the first thing your ops team checks every morning. No digging through the full stock list — just “these things need ordering today.”
Inventory turnover rate. Are you holding too much? This metric — how many times you sell and replace your inventory in a period — shows where capital is sitting idle versus moving efficiently.
Supplier lead times. If your supplier takes 14 days to deliver and you have 10 days of stock left, you’re already too late. Tracking lead time by supplier lets you adjust reorder points accordingly.
Inbound shipments. What’s on order and when it arrives. Stock on-hand plus stock incoming is the full picture — a dashboard that only shows current inventory misses half the story.
Where Your Inventory Data Lives
Most small and mid-sized ops teams track inventory across a few places:
- A master stock spreadsheet (Google Sheets or Excel) updated manually or via inventory software exports
- A sales platform (Shopify, WooCommerce, or similar) that records units sold
- A purchase order tracker — often another spreadsheet — logging supplier orders and expected delivery dates
None of these talk to each other automatically. The result is a reconciliation task someone has to do manually, usually too infrequently, usually after a problem has already happened.
The fastest path to a working dashboard: consolidate your key data into a single Google Sheet with consistent columns, then connect that to Infograph.
Building Your Inventory Dashboard with Infograph
Step 1: Set Up a Consolidated Data Sheet
Create a Google Sheet with one row per SKU. Include columns for: SKU, product name, current stock, reorder point, reorder quantity, days of stock (calculated from stock and daily sales rate), and supplier lead time.
If your inventory software exports CSVs, that’s your starting point — clean up the columns, add any missing fields, and you have your source data.
Step 2: Connect to Infograph
Connect the Google Sheet directly to Infograph. The live connection means updates to the sheet — a new delivery logged, stock levels adjusted — reflect in the dashboard automatically.
If you’re starting with a CSV export, upload that first to get the dashboard running. Add the live connection when you’re ready.
Step 3: Describe Your Dashboard
Type what you want to see:
“Show current stock levels for all SKUs in a table, color-coded by status: red below reorder point, yellow within 20% of reorder point, green above. Add a bar chart of days of stock remaining by product. Create an alert panel showing all SKUs below their reorder point.”
Infograph builds from your data. It reads your column headers and maps them to the right chart types — you’re not configuring anything manually.
Step 4: Iterate
Add what you need as you go. “Add a card showing total inventory value.” “Show a trend line of stock levels for my top 10 SKUs over the last 30 days.” “Add a table of inbound shipments sorted by expected delivery date.”
Every change is immediate. Keep refining until the dashboard shows what your team actually needs.
Step 5: Share and Automate
Publish the dashboard. Share it with your warehouse team, your purchasing manager, your operations lead. Set it as the browser homepage for anyone who needs to track inventory daily.
For teams with multiple people making purchasing decisions, a shared live dashboard replaces the chain of “what’s the stock level on X?” Slack messages. Everyone sees the same numbers at the same time.
From Reactive to Proactive
The real shift a good inventory dashboard creates isn’t operational — it’s behavioral. When stock levels are invisible, teams react to problems. When they’re visible, teams anticipate them.
Reorder alerts catch stockouts before they happen. Days-of-stock calculations flag issues a week in advance instead of the morning of. Supplier lead time data shows you which vendors are consistently late so you can adjust reorder points or find better suppliers.
You stop firefighting. You start planning.
Common Inventory Metrics Worth Adding
Once the core dashboard is running, these additions make it significantly more powerful:
- ABC analysis — categorizing SKUs by revenue contribution (A = top 20% of SKUs driving 80% of revenue) helps you prioritize reorder decisions
- Stockout frequency — how often does each SKU hit zero? High frequency items need higher reorder points
- Overstock flags — items with more than 60 days of stock are tying up capital; surface them so you can run promotions or reduce future orders
- Supplier performance — actual delivery date vs. promised delivery date, by supplier, over time
None of these require extra tools. They’re calculations on top of data you already have.
Start Free
Build your first inventory dashboard on Infograph’s free plan — no credit card required. Connect your Google Sheet, describe what you want to see, and have a working dashboard in minutes.
When you’re ready to add more dashboards or more team members, the Pro and Teams plans have you covered.


