Tableau vs Power BI is the most searched comparison in business intelligence, and for good reason — both are serious tools with serious price tags and serious learning curves.
If you’re already deep in the Microsoft ecosystem or have a dedicated BI team, this comparison matters. If you’re a smaller team that just needs dashboards that work, the honest answer might be that neither is the right fit.
Let’s be direct about both.
The Core Difference
Power BI is Microsoft’s BI tool. It’s deeply integrated with Excel, Azure, and the rest of the Microsoft stack. If your data lives in SharePoint, SQL Server, or Teams, Power BI is a natural fit. Pricing starts at $10/user/month for Power BI Pro.
Tableau is the visualization-first option. It produces better-looking charts out of the box and handles complex, large-scale data visualization more gracefully. It’s owned by Salesforce now. Pricing starts around $15/user/month for Tableau Creator (the tier you actually need to build things).
Both require meaningful upfront investment — in time, training, and money.
Pricing: Power BI Wins on Cost
Power BI Pro is $10/user/month. Tableau Creator is around $15/user/month, and that’s the minimum tier that lets you build dashboards — Viewer licenses are cheaper but can’t create anything.
For larger organizations, both offer premium/enterprise tiers that cost significantly more.
If budget is the primary constraint: Power BI is cheaper.
Ease of Use: Neither Is Easy
This is where both tools get oversold.
Power BI requires learning DAX (Data Analysis Expressions), a formula language that takes weeks to get comfortable with. Building even moderately complex calculations means writing DAX. The interface has improved, but it still has a Windows-application feel and a steep initial climb.
Tableau has a more intuitive drag-and-drop interface for basic visualizations, but anything beyond simple charts requires understanding Tableau’s data model, calculated fields, and LOD (Level of Detail) expressions. It’s more visual, but not simpler.
Both tools assume you’ll invest time in learning them. Neither is designed for occasional users.
Visualization Quality: Tableau Wins
This is Tableau’s clearest advantage. Charts are more polished, interaction design is smoother, and the output looks more professional with less effort.
Power BI has improved dramatically in recent years and is capable of excellent visualizations — but it requires more configuration to get there. The default chart styles still look like a Microsoft product.
If your dashboards are client-facing or require premium visual quality, Tableau has an edge.
Data Connectivity: Power BI Wins for Microsoft Stack
Power BI connects natively to everything Microsoft — Excel, SharePoint, SQL Server, Azure, Teams. If your organization runs on Microsoft, the data plumbing is easier.
Tableau connects to more data sources overall and has historically had stronger native connectors for a broader range of databases. But for most mid-market organizations, Power BI’s connectors are more than sufficient.
Collaboration and Sharing
Power BI: dashboards are shared through Power BI Service (the cloud version). Your audience needs either a Power BI Pro license or you need a Premium capacity workspace — which gets expensive fast.
Tableau: sharing works through Tableau Server (self-hosted) or Tableau Cloud. Both require licenses for viewers at scale.
Neither tool makes sharing free or simple. This is one of the most common frustrations teams run into after building their first dashboard.
When to Choose Power BI
- Your team already uses Microsoft 365
- Your data primarily lives in Excel, SQL Server, or Azure
- Budget is tight and $10/user/month beats $15+
- You have someone willing to learn DAX
When to Choose Tableau
- Visual quality and presentation matter more than cost
- You work with large, complex datasets that need rich interactivity
- Your team has existing Tableau training or experience
- You’re in a Salesforce-heavy environment
When to Choose Neither
Here’s the honest part.
Tableau and Power BI are enterprise tools built for teams with dedicated data people, training budgets, and complex analytical needs. For a lot of teams — especially smaller ones — they’re overkill.
If what you actually need is: connect your data source, get a clean dashboard, share it with your team — there are faster ways to get there.
Infograph is built for exactly that gap. Connect a Google Sheet or upload a CSV, describe what you want in plain English, and get a working dashboard in minutes. No DAX. No calculated fields. No training required.
It’s not a replacement for Tableau or Power BI if you need enterprise-scale analytics. But if you’re spending more time fighting your BI tool than reading your data, it’s worth trying.
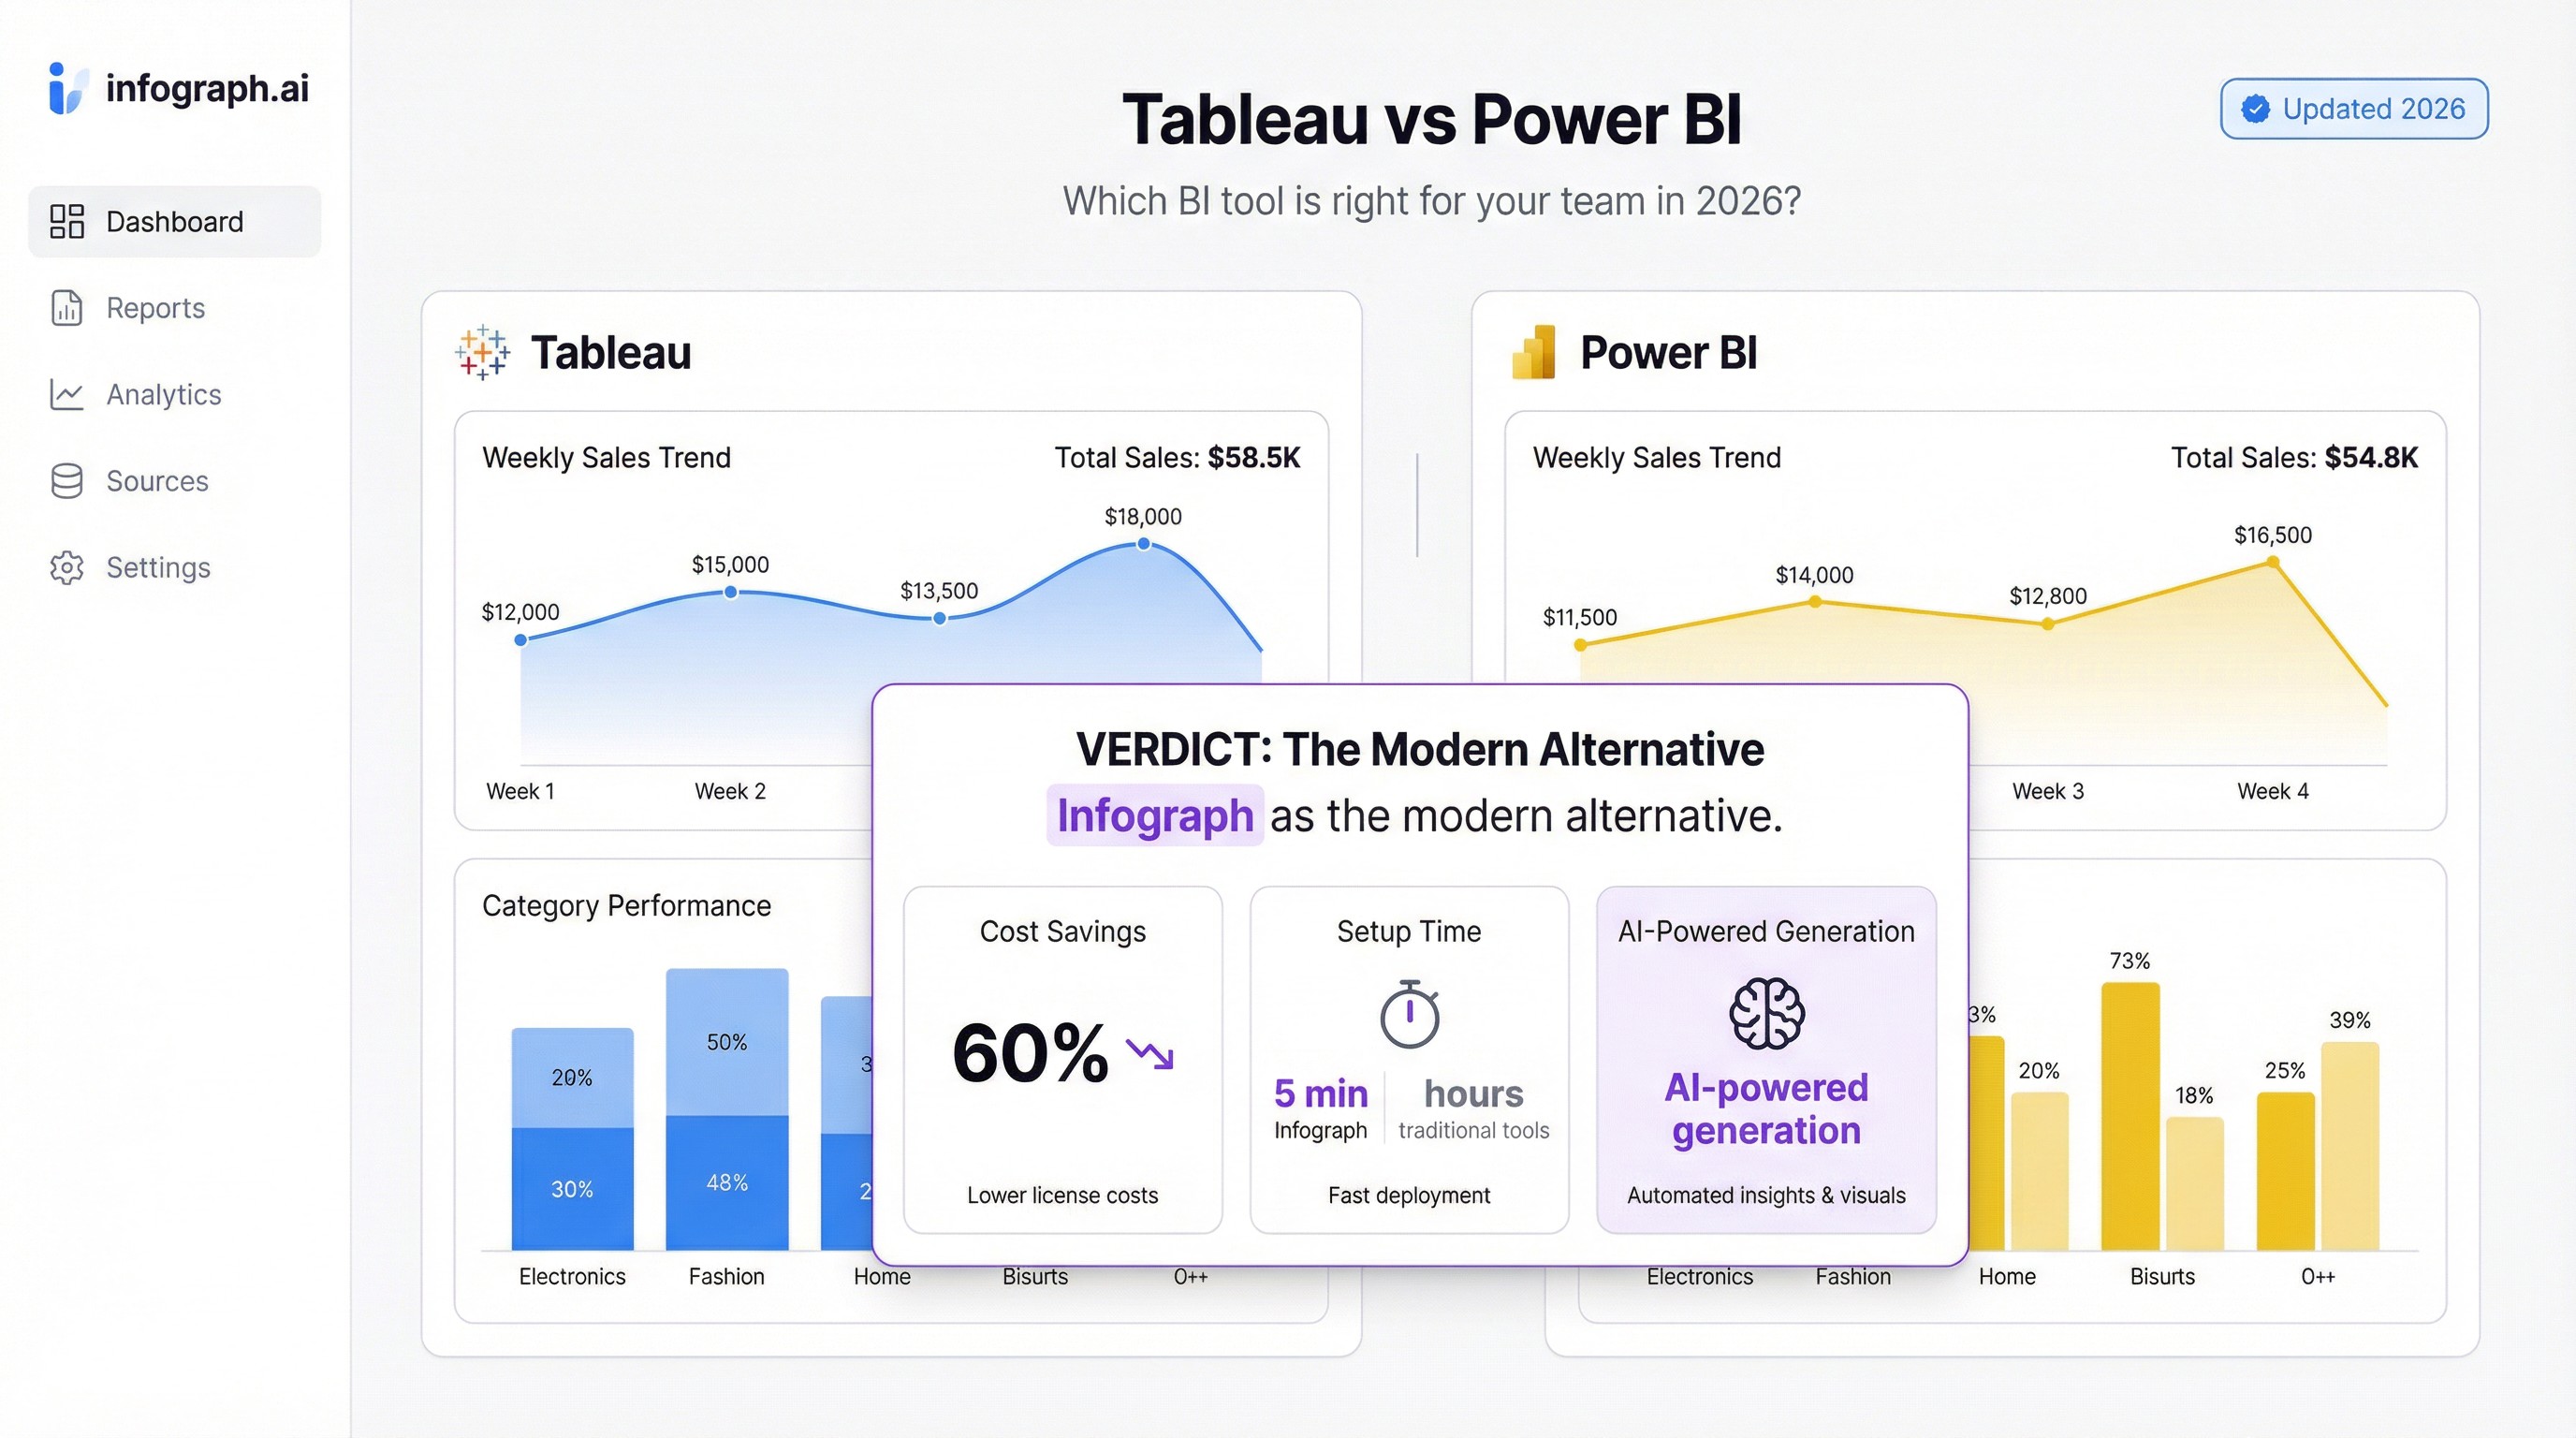
The bottom line: Power BI wins on price and Microsoft integration. Tableau wins on visualization quality. Both require real investment to use well.
If you want dashboards without the complexity, try Infograph free — no credit card required.