Excel dashboards are a tax on your time. Not a small one — a significant, recurring, soul-grinding tax that compounds every time your data changes and your carefully assembled charts collapse into chaos.
This is the guide for escaping that.
The Honest Problem With Excel Dashboards
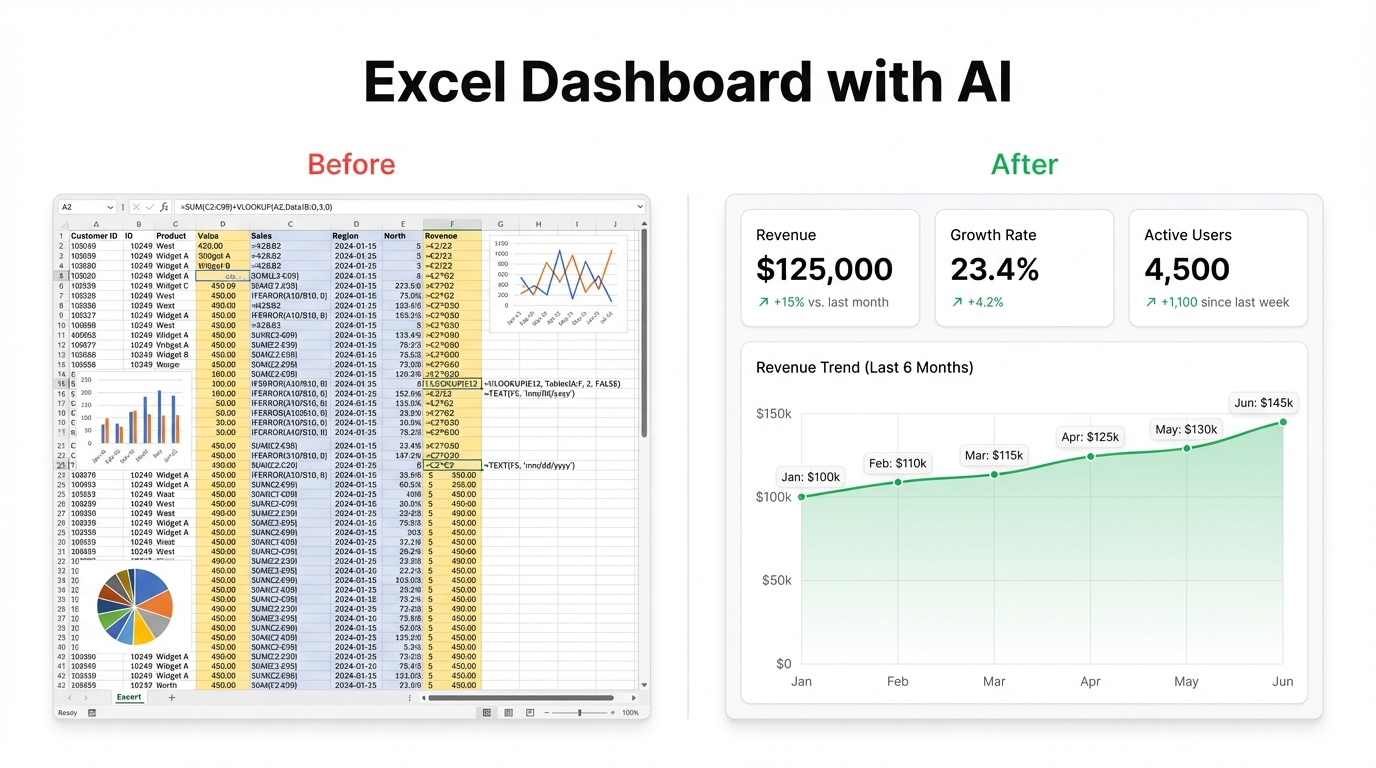
Here’s the thing most Excel tutorials won’t say: the process is genuinely terrible. You start with a spreadsheet full of data that makes sense to you. Then you spend three hours doing the following: building pivot tables that summarise the wrong thing, writing VLOOKUPs that break when someone adds a column, creating charts that look fine until the data updates and suddenly they’re pointing at empty cells, and manually formatting everything to look presentable for a meeting that’s in 45 minutes.
It’s not that Excel is bad software. It’s that dashboards are a fundamentally different task from spreadsheets, and trying to build one inside the other is like using a hammer as a paintbrush. You can do it. It’s just awful.
The specific failure modes are predictable:
Pivot tables that need constant babysitting. Every time your source data changes shape — new columns, renamed headers, extra rows — your pivot tables need manual updates. This isn’t a bug, it’s how they work. But it means dashboards require ongoing maintenance to stay accurate, which means they usually aren’t.
Formula chains that nobody can read six months later. =IFERROR(VLOOKUP(A2,Sheet3!$B$2:$F$500,4,FALSE),"") made sense when you wrote it. Now you’re scared to touch it because you don’t know what breaks if you change column C.
Charts that look different on different screens. You spent 20 minutes getting the colours right and the legend positioned correctly. Your colleague opens it on their laptop and the layout is scrambled. You move on because fixing it would take another 20 minutes.
No live updates. Your dashboard shows last Tuesday’s numbers because that’s when you last manually refreshed the data. That’s not a dashboard. That’s a report about the past.
What Actually Changes When You Use AI
The shift isn’t just speed — it’s the entire mental model.
With AI, you describe what you want to see, and the dashboard gets built to match that description. You’re not configuring a chart type or dragging fields into a pivot builder. You’re writing a sentence: “Show me monthly revenue broken down by product category, with a running total.” That’s it.
The AI handles the underlying data work. It figures out which columns matter, how to aggregate them, what visualisation makes sense, and how to connect everything so updates flow through automatically.
What you get back isn’t a static snapshot — it’s a live dashboard that updates when your data does. Change a number in your spreadsheet? The dashboard reflects it. Add a new row? It’s included. No formulas to fix, no pivot tables to refresh, no charts to rebuild.
This sounds like marketing language until you actually try it. Then it sounds like the obvious way things should have worked all along.
How to Build an Excel Dashboard Using Infograph
Here’s the actual process.
Step 1: Upload Your Excel File
Go to app.infograph.ai and create a new dashboard. You’ll be prompted to connect a data source. Choose Upload File and drop your Excel file in — .xlsx and .xls both work.
Infograph reads the file, identifies your sheets and columns, and gets ready to work with your data. This takes about 5 seconds.
Step 2: Prompt for What You Want to See
This is the part that feels too simple to work. Type what you want your dashboard to show.
You can be specific: “Show me total sales by region for the last 90 days, a month-over-month comparison, and flag any region where sales dropped more than 10%.”
Or you can be general: “Give me an overview of this sales data.”
Either works. If you’re specific, you get exactly that. If you’re vague, Infograph makes reasonable choices about what to surface and you can adjust from there. Most people start vague, see what comes back, then prompt again to refine.
Good prompts tend to mention:
- What metric matters (revenue, units, conversion rate, headcount)
- How you want to break it down (by time, region, product, rep)
- Any comparisons you care about (vs. last period, vs. target)
- Anything you want flagged or highlighted
Step 3: Watch the Dashboard Get Built
Infograph generates the dashboard in seconds. You’ll typically see a mix of KPI cards for your headline numbers and charts for trends or breakdowns. The layout is clean, the colours are sensible, and everything is labelled correctly from your actual column headers.
From here you can:
- Prompt again to add, remove, or change anything: “Add a bar chart breaking down revenue by product.”
- Change the theme — Infograph has a set of visual themes and you can dial in brand colours if you have them
- Share the dashboard — generate a link for your team, lock it to your organisation, or make it public
The whole process from upload to shareable dashboard runs under five minutes for most files.
Old Way vs. New Way
| Task | Excel Manual | Infograph |
|---|---|---|
| Initial setup | 2–4 hours | Under 5 minutes |
| Updating when data changes | Manual refresh, fix broken charts | Automatic |
| Adding a new visualisation | Configure chart type, link data range, format | Type what you want |
| Sharing with team | Export to PDF or share the file | Generate a link |
| Non-technical team members can edit | No | Yes |
The time difference compounds. A dashboard you build manually takes hours to set up and ongoing maintenance every time data changes. A dashboard built in Infograph takes minutes to set up and maintains itself.
There’s also a quality difference worth mentioning. Infograph dashboards look professional by default — clean typography, consistent spacing, proper data labelling. Excel dashboards look like what they are: something someone spent an afternoon putting together inside a spreadsheet application. That’s not a criticism of the person; it’s just not what Excel is designed for.
When Excel Dashboards Still Make Sense
Honest answer: almost never for actual dashboards. Excel is excellent for data storage, calculation, and exploration. It’s where you do your analysis. Dashboards are the output of that analysis — the view you share, the thing you check every morning, the report that goes to leadership.
Trying to do both in the same tool means doing both worse.
If you have a simple, static summary that never changes and only you ever look at it, a formatted Excel sheet is fine. For anything you share, anything that updates, or anything that needs to communicate clearly to people who didn’t build it — a proper dashboard tool wins.
Connect Your Excel File Live
One more thing worth knowing: if your Excel file lives in Microsoft OneDrive or SharePoint, Infograph can connect to it directly. You give it access to your online spreadsheet, and the dashboard updates automatically whenever the file changes. No re-uploading, no manual refresh. Your team can always see current data.
This works for Google Sheets too. The pattern is the same: connect once, and the dashboard stays live.
Build Your Dashboard Now
Upload your Excel file at app.infograph.ai. You don’t need a credit card to start — the free plan gives you enough to build your first dashboard and see exactly what this feels like.
The formula-free part isn’t a gimmick. It’s just how it works.
Want more insights like this?
Read more posts